


Contents
Scroll to:
https://doi.org/10.47183/mes.2025-265
Scroll to:
Introduction. Forensic medical examinations frequently encounter poorly understood, potentially hazardous psychoactive substances. At the same time, information on the biological activity of such substances may be either fragmentary and contradictory or absent altogether. Therefore, the development of approaches to predicting the health hazard of xenobiotics is an urgent task of emergency medicine.
Objective. To study the relationship between physicochemical properties and the hazard rate of one class of CNS-active substances using the methods of mathematical analysis followed by scientific substantiation of criteria for preliminary hazard assessment of narcotic drugs.
Маterials and methods. The study models included the known structures of narcotic analgesics, divided into three groups according to their potential hazard rate. The physicochemical properties of such substances, i.e., molecular weight, polarity, polar surface area, distribution coefficients, and basic dissociation constants were considered as potential hazard factors. Linear discriminant analysis was used to identify the relationship between the physicochemical properties of psychoactive substances and their hazard potential.
Results. The considered example of one class of CNS-active substances confirms the relationship between their hazard rate and the physicochemical properties affecting their redistribution from the central bloodstream to the central nervous system. Physicochemical criteria for predicting the hazard rate of psychoactive substances are proposed. These criteria serve as classification functions that distinguish groups of model substances.
Conclusions. The physicochemical properties of psychoactive substances and the strength of their binding to target receptors equally determine the characteristics of their toxic effect. The formulated classification functions, calculated based on the physicochemical properties of substances, can be used for a preliminary hazard assessment of xenobiotics during their detection in biological samples.
Krivorotov D.V., Nikolaev A.I., Radilov A.S., Rembovsky V.R., Kuznetsov V.A. Physical and chemical criteria for hazard assessment of CNS-active xenobiotics. Extreme Medicine. 2025;27(1):15-25. https://doi.org/10.47183/mes.2025-265
The forensic medical examination of poisoning cases with psychoactive substances is carried out using targeted analytical methods, such as gas chromatography–mass spectrometry (GC-MS) and liquid chromatography-tandem mass spectrometry (HPLC-MS/MS), to detect known xenobiotics and their metabolites [1]. Untargeted testing using high-resolution liquid chromatography-mass spectrometry (HPLC-HRMS) technologies can be used to identify the chemical structure of new substances appearing in illicit traffic. Substances identified in biological samples can pose a significant threat [2–5]. Although the safety of a particular drug can be measured by determining its therapeutic index, calculated as the ratio of the drug maximum dose that does not exhibit toxicity to the dose that provides the desired effect (LD50/ED50), this approach cannot be used for substances detected during forensic medical examination. In addition, information about the hazardous pharmacological activity of xenobiotics may frequently be either fragmentary and contradictory or absent altogether, for a number of reasons:
The above reasons hamper the medicobiological assessment of new psychoactive substances, although there has been a growth in the number of cases of illicit trafficking both in Russia and globally [4][8–10]. In order to be able to predict the potential hazard of CNS-active xenobiotics and other chemical substances, criteria for a straightforward determination of their toxic effect are required.
It is common knowledge that the toxicity of many narcotic analgesics is associated with opioid-induced respiratory depression, which result in the patient’s death in the absence of proper treatment [11]. The central generator of breathing patterns in the brainstem is the preBötzinger Complex and the Kolliker–Fuse nucleus. In these areas of the brain, only 70–140 neurons are involved in responding to an increase in carbon dioxide (pCO2) levels and a decrease in blood oxygenation (pO2), which is necessary for the reflex mechanism of respiration [12]. Accordingly, the mechanism of regulation of respiratory activity is extremely vulnerable to substances capable of selectively affecting these targets in the brain. It can be assumed that the health hazard of CNS-active xenobiotics, expressed in terms of strength and speed, is mediated, on the one hand, by factors determining the degree of their effect on target receptors in the neurons of these brain regions, and, on the other, by factors determining the transfer of xenobiotics from the central bloodstream to their biological targets in the brain.
The strength of narcotic analgesics is often associated with the inhibition constants of opioid receptors [13]. However, under standardized conditions, morphine and fentanyl, which differ significantly in the strength of their analgesic effects, possess comparable inhibition constants (Ki) of the μ-opioid receptors (MOR) (Table 1) [5][7].
Table 1. Inhibition constants of µ-opioid receptors by some narcotic analgesics
|
Low-affinity ligands, Ki>100 nM |
Morphine-like ligands, Ki=1–100 nМ |
High-affinity ligands, Ki<1 nM |
|||
|
medication |
Ki (nM) MOR |
medication |
Ki (nM) MOR |
medication |
Ki (nM) MOR |
|
tramadol |
1248.6 |
hydrocodone |
41.58 |
butorphanol |
0.76 |
|
codeine |
734.2 |
oxycodone |
25.87 |
levorphanol |
0.41 |
|
meperidine |
450.1 |
diphenoxylate |
12.37 |
oxymorphone |
0.40 |
|
propoxyphene |
120.2 |
alfentanil |
7.39 |
hydromorphone |
0.36 |
|
pentazocine |
117.8 |
methadone |
3.37 |
buprenorphine |
0.21 |
|
nalbuphine |
2.11 |
sufentanil |
0.13 |
||
|
fentanyl |
1.34 |
||||
|
morphine |
1.16 |
||||
Table prepared by the authors using data from [7]
Upon closer examination, no direct relationship exists between the analgesic activity of opioids and the strength of their binding to the receptor, which was earlier confirmed by numerous examples [14]. Thus, according to Boström et al., oxycodone, which binds to opioid receptors more than 20 times less strongly than morphine (Table 1), exhibits a 1.8-fold greater analgesic activity. This effect can be explained by its higher concentration in the target brain tissues than in the blood. Morphine, on the contrary, has an achievable concentration in the brain of rats several times lower than in the blood [15]. Thus, the binding of small molecules to opioid receptors in most cases is the determining condition for manifestation of analgesic activity, although being not the main factor in the strength and speed of its manifestation (similar to the classical works of N.V. Lazarev on the manifestation of narcotic properties in hydrocarbons (non-electrolytes)) [16]. The hazardous effects of opioid analgesics are also related to their properties, which determine the characteristics of entry into target tissues, organs, and targets in the central nervous system (CNS) through the blood-brain barrier (BBB).
The BBB acts as a filter through which nutrients flow from the bloodstream to the brain and in the opposite direction, while the waste products of the nervous tissue are removed. The BBB protects the brain from microorganisms, toxins, cellular and humoral factors of the immune system, and xenobiotics circulating in the blood. Drugs acting on CNS targets must have the ability to penetrate such a biological barrier. Currently, three main ways of transporting small molecules to brain tissues are being considered, including unidirectional penetration into the brain through passive and facilitated diffusion, due to a concentration gradient of substances and requiring no additional energy; active transport, requiring energy (ATP) for the transport of molecules against a concentration gradient; passive diffusion for moderately lipophilic medications and active transport mechanisms for penetration through the BBB of predominantly polar molecules [17][18].
The membranes separating the cells of the BBB layers act as a channel for the diffusion of organic molecules through the BBB cellular layers. In order to pass through such a channel, a molecule dissolved in the blood must be transformed during a multi-stage physicochemical process of desolvation and charge loss for a non-covalent interaction with the phospholipid bilayer. This process is similar to that of ligand-receptor interaction, although with lower steric requirements. Therefore, for penetration into the brain, small molecules must exhibit a set of specific properties, such as optimal geometric size, ionization properties, flexibility, etc. Thus, lipophilicity is a parameter that correlates well with the analgesic power of anesthetics and analgesics. This parameter, expressed in the form of LogP [16], is now considered as a composite descriptor describing the contribution of steric intermolecular interactions and that of formed hydrogen bonds [17]. Descriptors of hydrogen bond formation are properties of molecules, such as polarizability, polar surface area, the number of donors and acceptors of hydrogen bonds, or heteroatoms capable of their formation. Polar compounds with a high potential for hydrogen bonding, e.g., peptides, cannot easily penetrate the BBB. Polarizability, underlying a number of physical properties of substances, including surface tension and solubility, is characterized by a dipole moment. The polar surface area is defined as the sum of the surfaces of all polar atoms or molecules, primarily oxygen and nitrogen. Medications acting on the CNS possess smaller polar surface areas (PSA) than other classes of drugs, usually no more than 90 A2. Molecules with a polar surface area of more than 140 A2 do not readily penetrate cell membranes.
Geometric and steric factors expressed by the molecular weight, molecular volume, and flexibility of the molecule, are important for diffusion through biological membranes. For effective penetration through the BBB, the molecular weight should not exceed 400 Da. The molecular volume as a function of the molecular weight and structure takes all the conformations available to the molecule into account. The presence of more than ten rotating connections in structures correlates with a decrease in their bioavailability and CNS activity. The limited flexibility and compactness of molecules with fewer polar groups on their surface capable of functioning as donors and acceptors of hydrogen bonds is an advantage for substances acting on the CNS; therefore, the parameters describing these properties are significant factors related to the CNS activity of xenobiotics.
Most CNS-active substances have a nitrogen atom capable of ionization in the blood plasma. The resulting charge of the protonated molecule negatively affects its ability to diffuse through the dielectric layers of phospholipid membranes, compared to neutral molecules [18]. However. the presence of a positive charge on the nitrogen atom is considered an important factor for the electrostatic interaction of substances with the key amino acids of target receptors [19]. The molecule ionization degree in the buffer system of the blood and cerebrospinal fluid is a dualistic factor related both to the rate of entry of active molecules into CNS tissues and influencing their ability to bind to CNS targets [20, 21]. Thus, the severity of the toxic effect of CNS-active substances, due to the effectiveness of their entry into the brain, is determined by the sum of physicochemical factors related to their chemical structure. These factors can be experimentally evaluated or calculated.
This work is aimed at studying the relationship between the physicochemical properties of one class of CNS-active substances and their health hazard potential using mathematical analysis. On this basis, criteria for preliminary hazard assessment of narcotic drugs are substantiated.
Table 2 presents a sample of model objects used in the study selected from the known structures of narcotic analgesics. The objects under consideration were divided into three groups:
Table 2. Characteristics of the training sample of model substances
|
Group |
Model objects |
Information source |
Structures number |
Assessment of model objects |
|
1 |
Medical narcotic analgesics |
[7] |
17 |
substances with a hazard risk |
|
2 |
Non-medical narcotic analgesics |
[22] |
18 |
substances with a high hazard risk |
|
3 |
Highly active narcotic analgesics |
[3][14] |
18 |
substances with an extremely high hazard risk |
|
Total number of training sample structures |
53 |
|||
Table prepared by the authors using data from [3][7][14] and [22]
The physicochemical properties that can be measured without laborious experiments and reference materials of controlled substances were considered as potential descriptors of the hazard rate of CNS-active xenobiotics (see Table 3). The molecular weight of substances was determined by GC-MS; the distribution constants “octanol/water” and acid-base dissociation correlated with retention times were established by HPLC [21][23]. In cases where information about the structural formula of a xenobiotic can be found in mass spectrometry databases, computer simulation methods using accessible and reliable calculation algorithms are used to determine its physicochemical properties [24].
Table 3. Selected physicochemical descriptors of the hazard level of CNS-active xenobiotics
|
Parameter designation |
Parameter Description |
Dimension |
Determination possibility |
|
LogP / LogD7.4 |
The partition coefficient of the substance in the octanol–water system reflects the lipophilicity of the substances; the ability to dissolve in fats, lipids, and other media at pH 7.0 (LogP) or at physiological pH (LogD7.4) during the distribution of substances in the body. |
– |
HPLC is experimental, by calculation methods |
|
pKb |
The basic dissociation constant determines the lipophilicity of ionized molecules. |
– |
HPLC is experimental, by calculation methods |
|
MW |
The molecular weight of the substance reflects the steric factors affecting the distribution of substances in the body. |
Da |
HPLC-MS is experimental, by calculation methods |
|
TPSA |
The topological polar surface area is a calculated parameter, associated with the ability of substances to cross biological membranes |
Å2 (10–16cm2) |
by calculation methods |
|
Polar |
Polarizability — the physical property of substances to acquire an electric or magnetic dipole moment in an external electromagnetic field and associated with the ability of substances to form hydrogen bonds and overcome biological membranes |
Å3 (10–24cm3) |
by calculation methods |
Table prepared by the authors
The values of the selected physicochemical parameters for the training sample of substances were calculated using the ACD/Percepta software [24]. The methods of descriptive statistics and the method of linear discriminant analysis using the Statistica 6.0 statistical analysis application were used for mathematical data analysis. We previously showed the effectiveness of multidimensional statistics (chemometry) methods, in particular linear discriminant analysis and multiple regression for calculating toxic properties of refrigerants based on the physicochemical parameters of molecules [25], for assessing the degree of exposure to xenobiotics and noninvasive diagnosis of a number of diseases based on the spectral characteristics of biological samples1 [26].
The generated sample contained 53 anonymized records of the calculated values of the physicochemical properties of the model CNS-active substances described in the literature (Table 2). The structures of the analyzed model preparations were used for calculating the selected physicochemical quantities, the results of which are shown in Table 4.
Table 4. Calculation of physicochemical descriptors
|
No. |
Model object |
Group number |
Calculated physicochemical descriptors |
|||||
|
LogD7.4 |
LogP |
MW |
TPSA |
Polar |
pKb |
|||
|
1 |
fentanyl |
1 |
3.32 |
4.08 |
336.47 |
23.55 |
41.09 |
8.08 |
|
2 |
buprenorphine |
1 |
3.48 |
4.45 |
467.64 |
62.16 |
52.07 |
8.26 |
|
3 |
methadone |
1 |
3.12 |
4.44 |
309.44 |
20.31 |
38.02 |
8.70 |
|
4 |
levorphanol |
1 |
1.94 |
3.21 |
257.37 |
23.47 |
30.49 |
8.61 |
|
5 |
hydrocodone |
1 |
0.57 |
1.31 |
299.36 |
38.77 |
32.32 |
8.06 |
|
6 |
pentazocine |
1 |
3.05 |
3.79 |
285.42 |
23.47 |
34.96 |
8.04 |
|
7 |
butorphanol |
1 |
1.96 |
3.52 |
327.46 |
43.7 |
37.64 |
8.85 |
|
8 |
propoxyphene |
1 |
3.97 |
4.85 |
339.47 |
29.54 |
40.58 |
8.23 |
|
9 |
meperidine |
1 |
1.22 |
2.44 |
247.33 |
29.54 |
28.25 |
8.60 |
|
10 |
nalbuphine |
1 |
0.98 |
2.03 |
357.44 |
73.16 |
38.11 |
8.35 |
|
11 |
tramadol |
1 |
0.71 |
2.54 |
263.37 |
32.7 |
30.90 |
9.24 |
|
12 |
hydromorphone |
1 |
0.53 |
1.29 |
285.33 |
49.77 |
30.41 |
8.03 |
|
13 |
codeine |
1 |
0.34 |
1.21 |
299.36 |
41.93 |
32.84 |
8.21 |
|
14 |
morphine |
1 |
-0.18 |
0.69 |
285.33 |
52.93 |
30.93 |
8.16 |
|
15 |
oxycodone |
1 |
0.16 |
0.91 |
315.36 |
59.00 |
32.95 |
8.06 |
|
16 |
diphenoxylate |
1 |
5.42 |
5.72 |
452.58 |
53.33 |
52.93 |
7.40 |
|
17 |
oxymorphone |
1 |
0.25 |
1.00 |
301.33 |
70.00 |
31.03 |
8.03 |
|
18 |
4-fluorophenyl |
2 |
3.11 |
3.87 |
354.46 |
23.55 |
41.09 |
8.07 |
|
19 |
furanyl-fentanyl |
2 |
3.35 |
4.12 |
374.47 |
36.69 |
44.25 |
8.08 |
|
20 |
3-methylthiophentanyl |
2 |
2.96 |
4.09 |
356.52 |
51.79 |
42.32 |
8.50 |
|
21 |
β-hydroxy-thiophentanyl |
2 |
2.38 |
2.77 |
358.49 |
72.02 |
41.06 |
7.58 |
|
22 |
β-hydroxy-fentanyl |
2 |
2.87 |
3.07 |
352.47 |
43.78 |
41.70 |
7.15 |
|
23 |
α-methyl-thiophentanyl |
2 |
3.15 |
4.04 |
356.52 |
51.79 |
42.25 |
8.23 |
|
24 |
α-methyl-fentanyl |
2 |
2.75 |
4.09 |
350.49 |
23.55 |
42.89 |
8.73 |
|
25 |
acetyl-α-methylfentanyl |
2 |
2.56 |
3.91 |
336.47 |
23.55 |
41.05 |
8.73 |
|
26 |
3-methylbutyril fentanyl |
2 |
4.21 |
4.98 |
364.52 |
23.55 |
44.79 |
8.08 |
|
27 |
remifentanil |
2 |
1.77 |
1.85 |
376.44 |
76.15 |
40.06 |
6.70 |
|
28 |
4-methoxy-butyrylfentanyl |
2 |
3.55 |
4.33 |
380.52 |
32.78 |
45.58 |
8.10 |
|
29 |
thiofentanyl |
2 |
2.66 |
3.79 |
342.49 |
51.79 |
40.45 |
8.50 |
|
30 |
4-fluoro-butyrylfentanyl |
2 |
3.69 |
4.44 |
368.48 |
23.55 |
42.93 |
8.07 |
|
31 |
3-methylfentanyl |
2 |
3.36 |
4.13 |
350.49 |
23.55 |
42.96 |
8.08 |
|
32 |
acrylic fentanyl |
2 |
2.99 |
3.75 |
334.45 |
23.55 |
40.98 |
8.08 |
|
33 |
acetylfentanyl |
2 |
2.98 |
3.74 |
322.44 |
23.55 |
39.25 |
8.08 |
|
34 |
alfentanil |
2 |
1.99 |
2.04 |
416.51 |
81.05 |
46.25 |
6.53 |
|
35 |
sufentanil (SF) |
2 |
2.91 |
3.77 |
386.55 |
61.02 |
44.80 |
8.20 |
|
36 |
pyrrole analog SF No.1 |
3 |
2.33 |
2.55 |
383.48 |
54.78 |
44.16 |
7.19 |
|
37 |
etorfin |
3 |
2.30 |
3.09 |
411.53 |
62.16 |
45.51 |
8.07 |
|
38 |
heterocyclic analogue CF No.1 |
3 |
3.05 |
3.10 |
506.59 |
90.47 |
54.93 |
6.43 |
|
39 |
heterocyclic analogue SF No.1 |
3 |
1.80 |
2.67 |
462.58 |
65.45 |
53.43 |
8.20 |
|
40 |
heterocyclic analogue SF No.2 |
3 |
3.14 |
3.26 |
449.54 |
70.16 |
49.87 |
6.86 |
|
41 |
heterocyclic analogue CF No.2 |
3 |
2.93 |
2.98 |
463.52 |
87.23 |
49.82 |
6.43 |
|
42 |
heterocyclic analogue SF №3 |
3 |
2.59 |
2.81 |
435.55 |
53.09 |
49.82 |
7.23 |
|
43 |
гетероцикл. аналог CF No.3 |
3 |
2.61 |
2.70 |
449.54 |
70.16 |
49.77 |
6.79 |
|
44 |
heterocyclic analogue CF No.4 |
3 |
2.53 |
2.65 |
483.60 |
87.23 |
52.76 |
6.90 |
|
45 |
pyrrole analog CF No.1 |
3 |
0.72 |
1.16 |
444.48 |
142.52 |
46.55 |
7.64 |
|
46 |
pyrrole analog SF No.2 |
3 |
1.59 |
2.46 |
370.48 |
50.6 |
43.21 |
8.20 |
|
47 |
pyrrole analog CF No.2 |
3 |
1.91 |
2.12 |
384.47 |
67.67 |
43.55 |
7.19 |
|
48 |
heterocyclic analogue CF No.5 |
3 |
2.26 |
2.86 |
415.55 |
90.98 |
45.91 |
7.86 |
|
49 |
ohmefentanyl |
3 |
3.04 |
3.24 |
366.49 |
43.78 |
43.57 |
7.15 |
|
50 |
3-thiophene-CF |
3 |
3.01 |
3.61 |
400.53 |
78.09 |
44.75 |
7.86 |
|
51 |
vinyl-CF |
3 |
3.19 |
3.51 |
392.49 |
49.85 |
45.29 |
7.44 |
|
52 |
lofentanyl |
3 |
3.96 |
4.29 |
408.53 |
49.85 |
47.26 |
7.44 |
|
53 |
carfentanyl (CF) |
3 |
3.17 |
3.49 |
394.50 |
49.85 |
45.39 |
7.44 |
Table prepared by the authors using their own data
Table 5 presents the average values of the physicochemical descriptors used to construct regression models and to determine the limits of their applicability.
Table 5. Descriptor mean values by groups
|
Substance group |
Calculated physicochemical descriptors |
|||||
|
LogD7,4 |
LogP |
MW |
TPSA |
Polar |
pKb |
|
|
Group 1 |
1.46 |
2.49 |
300.7 |
40.79 |
34.04 |
8.35 |
|
Group 2 |
3.16 |
4.08 |
355.6 |
33.88 |
42.55 |
8.25 |
|
Group 3 |
2.51 |
2.83 |
414.9 |
69.86 |
46.58 |
7.28 |
|
All substances |
2.38 |
3.07 |
365.0 |
51.43 |
41.78 |
7.86 |
Table prepared by the authors using their own data
The average values of the physicochemical quantities presented in Table 5 show that the narcotic substances in Group 2 demonstrate the highest lipophilicity (LogP). At the same time, the ratio of the average lipophilicity values of the drug groups in water and blood plasma — LogP and LogD7.4 — shows that the lipophilicity of Groups 1 and 2 significantly decreases at physiological pH. Conversely, the highly active substances belonging to Group 3 and having a lower value of the basic ionization constant demonstrate high lipophilicity not only in water, but also in blood plasma. This emphasizes the relationship between lipophilicity and the ability of substances to enter CNS tissues during redistribution in the blood-brain system.
The physicochemical criteria that can be used for hazard assessment of CNS-active substances were established based on paired correlation coefficients between the physicochemical descriptors shown in Table 6. It can be seen that most descriptors are weakly correlated with one another. The strongest correlation is observed between the LogD7.4 and LogP values since these are highly similar parameters in nature. The difference between them is related to the pH values at which they are determined, being due to the degree of ionization of the molecules of substances at these pH values. This is indicated by a rather strong correlation (R = 0.97) between the calculated value (LogD7.4 – LogP) and the pKb value.
Table 6. Correlation coefficients of physicochemical descriptors
|
LogD7.4 |
LogP |
MW |
TPSA |
Polar |
pKb |
LogP — LogD7.4 |
|
|
LogD7.4 |
1.00 |
0.92 |
0.36 |
-0.31 |
0.58 |
-0.18 |
-0.21 |
|
LogP |
0.92 |
1.00 |
0.10 |
-0.52 |
0.35 |
0.20 |
0.18 |
|
MW |
0.36 |
0.10 |
1.00 |
0.64 |
0.96 |
-0.70 |
-0.68 |
|
TPSA |
-0.31 |
-0.52 |
0.64 |
1.00 |
0.43 |
-0.56 |
-0.53 |
|
Polar |
0.58 |
0.35 |
0.96 |
0.43 |
1.00 |
-0.60 |
-0.59 |
|
pKb |
-0.18 |
0.20 |
-0.70 |
-0.56 |
-0.60 |
1.00 |
0.97 |
|
LogP — LogD7.4 |
-0.21 |
0.18 |
-0.68 |
-0.53 |
-0.59 |
0.97 |
1.00 |
Table prepared by the authors using their own data
A strong correlation is also observed between the values of MW and Polar. This is likely to be due to a proportional increase in the integral polarizability of the molecule, associated with an increase in the number of polarizable fragments with increasing mass. An analysis of the obtained correlations between the physicochemical properties in the training groups of CNS-active substances showed that the values considered, either by themselves or in pairs, do not allow for an unambiguous distribution of substances to one of the three groups of hazardous substances.
A discriminant analysis was used to analyze the entire data set of physicochemical properties of model substances in order to identify their relationship with the degree of their health hazard. Discriminant analysis, as a branch of multidimensional statistical analysis, includes statistical methods for classifying multidimensional observations in a situation where the researcher has a priori so-called training samples (classification with learning). Discriminant analysis makes it possible to classify an object based on the measurement of various characteristics (features, descriptors), i.e., permitting their assignment to one of several groups (classes). In this study, discriminant analysis was used to determine the differences of aggregates in the mean of a variable (or a linear combination of variables) for subsequent use of this variable or a linear combination of variables as a criterion for the membership of new members to a particular group.
The resulting data set was subjected to a linear discriminant analysis (LDA) procedure with step-by-step inclusion of variables. The grouping variable was the “Group” category, with all other descriptors being used as independent variables. Initially, the data array was divided into two parts: one part was used as a training part to derive a mathematical classification model, while the second part acted as a control part to verify the resulting model. The last three compounds in the list of each group were used as controls.
In the process of LDA with step-by-step inclusion of variables, discriminant functions were determined. At each step, we analyzed all the variables to find the one that made the greatest contribution to the difference between the aggregates. This variable was included in the model at this step, and then the transition to the next step was carried out. The step-by-step variable inclusion mode allowed the minimum of variables to be involved in the analysis. The discriminant functions, expressing the maximum heterogeneity of groups among themselves, were linear combinations of variables optimized such that to discriminate groups among themselves most effectively. Since all discriminant functions were orthogonal, they collectively formed the phase space of discriminant functions, i.e., an n-dimensional Cartesian coordinate system, where n is the number of statistically significant discriminant functions.
The discriminant functions were uniform for the data set involved in LDA; however, the values of the roots of each of the discriminant functions were strictly specific for each substance. The roots of discriminant functions for each substance were calculated by matrix multiplication of a vector of descriptors of this substance by a matrix of coefficients of discriminant functions. Thus, the original data matrix was transformed into a matrix containing values of the roots of discriminant functions instead of descriptors. The values of the roots, unique to each junction, were essentially the coordinates of the points of the corresponding junctions in the phase space of the discriminant functions. The average values of these roots for each group determined the coordinates of the group centers (the so-called group centroids). It was the values of the roots of discriminant functions or the coordinates of objects (substances) in the phase space of discriminant functions that made it possible to classify objects, i.e., to correlate a specific substance with any of the groups by the proximity of a point to the centroid of the group.
The conducted LDA of the training sample of the data matrix with descriptors for three groups of substances produced two statistically significant discriminant functions dF1 and dF2. These functions were fully descriptive the data array, of which the dF1 function describes 88% of the information contained in the data presented in Table 7.
Table 7. Coefficients of discriminant functions for groups of model xenobiotics
|
Descriptor |
Non-standardized |
Standardized |
||
|
dF1 |
dF2 |
dF1 |
dF2 |
|
|
MW |
0.051 |
0.028 |
1.724 |
0.966 |
|
LogP |
2.599 |
-1.376 |
2.190 |
-1.159 |
|
LogD7.4 |
-1.943 |
0.845 |
-1.712 |
0.745 |
|
Polar |
-0.643 |
-0.359 |
-2.329 |
-1.300 |
|
TPSA |
-0.032 |
0.000 |
-0.611 |
-0.005 |
|
Constant |
6.638 |
7.010 |
0 |
0 |
|
Eigenval |
4.090 |
0.562 |
4.090 |
0.562 |
|
Cum.Prop |
0.879 |
1.000 |
0.879 |
1.000 |
Table prepared by the authors using their own data
Thus, the obtained discriminant functions are the following linear combinations of descriptor values:
dF1 = 0,051×MW + 2.599×LogP – 1.943×LogD7.4 – 0.643×
Polar – 0.032×TPSA + 6.638
dF2 = 0.028×MW – 1.376×LogP – 0.845×LogD7.4 – 0.359×
Polar + 7.010
The standardized coefficients for each descriptor for the dF1 function, which are relatively close to each other in absolute value and far from zero, indicate the important contribution of all the considered physicochemical indicators to the discrimination performed by this most statistically significant discriminant function. In principle, the same applies to the dF2 function, with the exception for the TPSA (topological area of the polar surface) indicator, which proved to be negligible.
For all model substances from Table 4, including the control ones, the values of the roots of the discriminant functions dF1 and dF2 were calculated. The root values, unique for each junction, are the coordinates of the points of the corresponding junctions in the phase space of discriminant functions, which is a flat coordinate system with the dF1 and dF2 axes. Figure 1 demonstrates the location of points corresponding to specific samples of substances from the three groups in the phase space of the dF1 and dF2 functions.
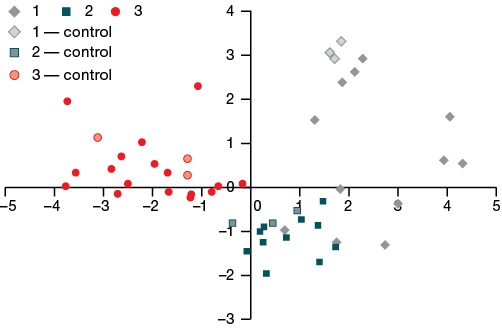
Figure prepared by the authors using their own data
Fig. 1. Roots values of the dF1 and dF2 discriminant functions for groups 1, 2, and 3 of model chemical xenobiotics, control compounds included
It can be seen from Fig. 1 that all groups are well separated from each other; all control points were determined in their groups.
For all three groups of model substances, the average values of the roots of the dF1 and dF2 discriminant functions were found, which are the coordinates of the centroids of the groups in the phase space of the dF1 and dF2 functions (Tables 8 and 9). The obtained discriminant functions, according to the data of the classification matrix (Table 9), possess a high discriminating power, allowing a fairly clear division of the groups of substances under consideration among themselves. Table 9 shows the LDA classification results for both the substances in the training sample and for all substances, including the control ones.
Table 8. Average values of the roots of the dF1 and dF2 discriminant functions for groups of model xenobiotics
|
Substance group |
dF1 |
dF2 |
|
Group 1 |
2.485±1.225 |
0.675±1.368 |
|
Group 2 |
0.797±0.716 |
–1.176±0.485 |
|
Group 3 |
0.797±0.716 |
0.255±0.809 |
Table prepared by the authors using their own data
Table 9. Classification matrix obtained for the substances of the training sample and for all substances, control substances included
|
Training sample only |
Group |
% of correct classification |
Group 1 |
Group 2 |
Group 3 |
|
1 |
75 |
9 |
3 |
0 |
|
|
2 |
100 |
0 |
11 |
0 |
|
|
3 |
100 |
0 |
0 |
19 |
|
|
Total |
92.9 |
9 |
14 |
19 |
|
|
All substances |
Group |
% of correct classification |
Group 1 |
Group 2 |
Group 3 |
|
1 |
80 |
12 |
3 |
0 |
|
|
2 |
100 |
0 |
14 |
0 |
|
|
3 |
100 |
0 |
0 |
22 |
|
|
Total |
94.1 |
12 |
17 |
22 |
Table prepared by the authors using their own data
In general, the substances were classified correctly, with the exception for substances No. 1, 2, and 8 from Group 1, which were clearly assigned to Group 2 already at the first LDA steps. This proves the validity of the mathematical model developed based on physicochemical properties for classifying substances from the class of opioid analgesics into groups.
Thus, in order to determine whether new compounds not included in the research list belong to one of the three groups, it would be necessary to:
It may happen that, when situated relatively far from all the centroids, the determined point will not belong to any of the three groups.
To directly calculate the classification index in order to assign the evaluated compounds to one of the three groups, the CF1-CF3 classification functions can be used to determine which group is most likely to be assigned to a xenobiotic. There are as many classification functions as there are groups:
СF1 = 0.276×MW + 22.406×LogP – 23.622×LogD7.4 + 0.906×
Polar – 0.160×TPSA – 66.585
СF2 = 0.137×MW + 20.566×LogP – 21.906× LogD7.4 + 2.657×
Polar – 0.105×TPSA – 88.554
СF3 = 0.034×MW + 11.248×LogP – 15.200×LogD7.4 + 3.963×
Polar + 0.013×TPSA – 97.835
For each new or known compound, all three functions are calculated, and the compound is assigned to the group for which the classification function is most important.
When new CNS-active substances and xenobiotics are being identified based on the proposed physicochemical criteria, they can be classified into one of three groups: substances with a hazard risk, those with a high hazard risk, and those with an extremely high hazard risk.
The operability of the created mathematical model was assessed using the classification of substances in the training sample. The obtained results of the classification of substances, which differ from the initial classification into groups in the training sample, are shown in Table 10.
Table 10. Classification of the substances other than the training sample
|
No. |
Model object |
Initial group |
Calculation of classification functions |
Defined group |
||
|
СF1 |
СF2 |
СF3 |
||||
|
1 |
fentanyl |
1 |
72.67 |
75.38 |
72.13 |
2 |
|
2 |
buprenorphine |
1 |
117.08 |
122.51 |
122.32 |
2 |
|
3 |
propoxyphene |
1 |
74.24 |
75.65 |
69.24 |
2 |
|
4 |
diphenoxylate |
1 |
97.91 |
107.42 |
109.98 |
3 |
|
5 |
β-hydroxy thiofentanyl |
2 |
64.01 |
67.06 |
73.06 |
3 |
|
6 |
β-hydroxy fentanyl |
2 |
62.37 |
66.13 |
70.84 |
3 |
|
7 |
remifentanil |
2 |
61.15 |
60.83 |
68.69 |
3 |
|
8 |
alfentanil |
2 |
76.10 |
81.34 |
93.42 |
3 |
|
9 |
sufentanil |
2 |
86.61 |
90.79 |
91.79 |
3 |
Table prepared by the authors using their own data
According to the results of the conducted classification, a potentially greater hazard was predicted for 9 out of 53 model substances than initially expected. The effectiveness of the proposed model for assessing the potential health hazard of CNS-active substances was demonstrated by the example of propoxyphene. This drug was initially classified as Group 1; however, further analysis clearly allocated it to Group 2, i.e., substances with a high hazard risk. Indeed, since 2009, this drug has been designated as hazardous in a number of countries and discontinued due to the high risk of fatal overdoses and cardiac arrhythmias.2 Table 10 also shows that certain drugs and substances detected in illicit trafficking may carry certain risks when used uncontrolled, which is consistent with the literature data on their toxic effects [22].
Diphenoxylate and buprenorphine, classified as Groups 2 and 3, respectively, can be considered as pharmacological exceptions. Diphenoxylate is used for gastrointestinal disorders, with its action being directed at opioid receptors located in the intestine. Therefore, the excessively high lipophilicity of diphenoxylate prevents its action on the CNS [23]. Buprenorphine, which belongs to the family of highly active Bentley compounds, is a powerful drug that could be just as dangerous as its related etorphine. Nevertheless, pharmacologically, it exhibits the properties of an opioid receptor agonist, posing no significant threat to human life. The results obtained emphasize that the proposed model based on the physicochemical properties of substances cannot take into account the peculiarities of their effect on CNS targets, such as receptors and enzymes. Hence, false positive and false negative results are possible in the resulting solutions. At the same time, the correct classification of most model compounds into groups according to their hazard potential shows the determining effect of the physicochemical properties of narcotic analgesics on their toxic action.
Using the example of representatives of one class of CNS-active substances, we confirmed the relationship between the potential health hazard of narcotic analgesics and their physicochemical properties, which determine the redistribution of such substances from the central bloodstream into the CNS tissues. The molecular weight, lipophilicity, ability to acid-base dissociation, polarity and polarizability of CNS-active substances, as well as their ability to bind to target receptors, equally determine the specific features of their toxic effects. Therefore, these physicochemical properties can serve as criteria for determining the health hazard potential of CNS-active xenobiotics.
The method of linear discriminant analysis with step-by-step inclusion of variables from a training sample of representatives of one class of CNS-active substances (opioid analgesics), divided into three groups according to their hazard level, was used to derive a mathematical model for classifying psychoactive substances based on their physicochemical properties. The model included two dF1 and dF2 discriminant functions as linear combinations of the values of physicochemical descriptors, allowing us to satisfactorily divide the considered groups of narcotic analgesics among themselves according to the criterion of potential threat. The CF1-CF3 classification functions were calculated to assign new compounds to a particular group.
The validity of the proposed mathematical model for assessing the potential hazard of CNS-active xenobiotics was confirmed on the example of classifying a training sample of substances. As a result, 44 substances out of 53 were classified correctly. The classification of seven substances was clarified; two substances proved to be pharmacological exceptions.
The calculated classification functions can be easily embedded as formulas in tabular editors or specialized software and databases for automatic classification of new and known compounds. Provided that the quantitative expression of the power and speed of action of opioid analgesics on the body and other parameters of molecules are determined, it becomes possible to conduct a mathematical analysis in order to establish a quantitative relationship between the characteristics of their biological activity and quantitative structure-activity relationship (QSAR). Of significant interest is the applicability of the results obtained in the study to other classes of CNS-active substances.
Undoubtedly, along with perfection of predictive methods, their results require confirmation by conventional toxicological methods. However, the demonstrated possibility of rapid detection of potentially hazardous xenobiotics will be useful for the prevention of mass poisoning when such CNS-active substances enter illicit traffic.
1. Rembovsky VR, Radilov AS, Dulov SA, Nikolaev AI. Assessment of the degree of exposure to xenobiotics based on the spectral characteristics of water-protein complexes of blood plasma. Methodological recommendations 12.11. Moscow: FMBA; 2012 (In Russ.).
2. Gandey A. Physicians Say Good Riddance to Worst Drug in History.2011. https://www.medscape.com/viewarticle/736718?src=mp&spon=25&form=fpf (Available from: 16 Jun 2024).
1. Zaikina OL, Lodjagin AN, Shilov VV. Gamma-hydroxybutyrate and fentanyl derivatives: chemical and toxicological confirmation of poisoning. Russian Journal of Forensic Medicine. 2016;2(2):112–3 (In Russ.). EDN: YHZMBF
2. Stanley TH, Egan TD, Aken HVan. A. Tribute to Dr. Paul A. J. Janssen: Entrepreneur Extraordinaire, Innovative Scientist, and Significant Contributor to Anesthesiology. Anesth. Analg. 2008;106(2):451–62.https://doi.org/10.1213/ane.0b013e3181605add
3. Lindsay CD, Riches JR, Timperley CM. Chemical Warfare Toxicology. Management of Poisoning Chemical Defence Against Fentanyls. The Royal Society of Chemistry. 2016;259–313. https://doi.org/10.1039/9781782628071-00259
4. Sosnov AV, Semchenko FM, Tohmahchi VN, Sosnova AA, et al. Selection criteria of compounds for development of high-potent analgesics and other CNS drugs. Drug development & registration. 2018;3(24):42–56 (In Russ.). EDN: OYVYND
5. Kelly E, Sutcliffe K., Cavallo D, Ramos-Gonzalez N, Alhosan N, et al. The anomalous pharmacology of fentanyl. Br J Pharmacol. 2023;180(7):797–812. https://doi.org/10.1111/bph.15573
6. Sosnov AV, Golubev SS, Punkevich BS, Sadovnikov SV, Zagrebin EM, et al. Reference standards of active ingredients of potent analgesic drugs. Drug development & registration. 2016;1(14):216–23 (In Russ.). EDN: WBODLX
7. Volpe DA, McMahon Tobin GA, Mellon RD et al. Uniform assessment and ranking of opioid μ receptor binding constants for selected opioid drugs. Regul Toxicol Pharmacol. 2011;59(3):385–90. https://doi.org/10.1016/j.yrtph.2010.12.007
8. Uyba VV, Krivorotov DV, Zabelin MV, Radilov AS, Rembovskiy VR et al. Opioid receptor antagonists. From the present to the future. Extreme Medicine. 2018;20(3):371-82 (In Russ). EDN: VNJTBG
9. Skolnick P. Treatment of overdose in the synthetic opioid era. Pharmacol. Ther. 2022;233:108019. https://doi.org/10.1016/j.pharmthera.2021.108019
10. Golovko AI, Ivnitsky Yu.Yu., Rejniuk VL, et al. Reasons for high lethality in overdose of drugs from the group of synthetic opioids Medline.ru. 2020;21:141–56 (In Russ). EDN: CMQERC
11. Hill R, Santhakumar R, Dewey W, Kelly E, Henderson G. Fentanyl depression of respiration: Comparison with heroin and morphine. Br J Pharmacol. 2020;177(2):254–66. https://doi.org/10.1111/bph.14860
12. Bachmutsky I, Wei XP, Kish E, Yackle K. Opioids depress breathing through two small brainstem sites. Elife. 2020;19;9:e52694. https://doi.org/10.7554/eLife.52694
13. Vardanyan RS, Hruby VJ. Vardanyan RS, Hruby VJ. Fentanyl-related compounds and derivatives: current status and future prospects for pharmaceutical applications. Future Med Chem. 2014;6(4):385–412. https://doi.org/10.4155/fmc.13.215
14. Bagley JR, Thomas SA, Rudo FG, Spencer HK, Doorley BM et al. New 1-(heterocyclylalkyl)-4-(propionanilido)-4-piperidinyl methyl ester and methylene methyl ether analgesics. J Med Chem. 1991;34(2):827–41. https://doi.org/10.1021/jm00106a051
15. Boström E, Hammarlund-Udenaes M, Simonsson US. Blood-brain barrier transport helps to explain discrepancies in in vivo potency between oxycodone and morphine. Anesthesiology. 2008;108(3):495–505. https://doi.org/10.1097/ALN.0b013e318164cf9e
16. Lazarev NV. Narcotic drugs. Leningrad: In-t gigieny truda i profzabolevanij Lengorzdravotdela. 1940 (In Russ.).
17. Raevsky OA, Solodova SL, Raevskaya OE, Mannhold R. Quantitative relationship between the chemicals structure and BBB-crossing ability of organic compounds. Pharmaceutical Chemistry Journal. 2012;46(3):3–8 (In Russ.). https://doi.org/10.30906/0023-1134-2012-46-3-3-8
18. Pajouhesh H, Lenz GR. Medicinal chemical properties of successful central nervous system drugs. NeuroRx. 2005;2(4):541–53. https://doi.org/10.1602/neurorx.2.4.541
19. Noha SM, Schmidhammer H, Spetea M. Molecular docking, molecular dynamics, and structure-activity relationship explorations of 14-oxygenated N-methylmorphinan-6-ones as potent μ-opioid receptor agonists. ACS Chem Neurosci. 2017;8(6):1327–37. https://doi.org/10.1021/acschemneuro.6b00460
20. Sugano K, Kansy M, Artursson P, Avdeef A, Bendels S, et al. Coexistence of passive and carrier-mediated processes in drug transport. Nat Rev Drug Discov. 2010;9(8):597–614. https://doi.org/10.1038/nrd3187
21. Šegan S, Jevtić I, Tosti T, Penjišević J, Šukalović V et al. Determination of lipophilicity and ionization of fentanyl and its 3-substituted analogs by reversed-phase thin-layer chromatography. J Chromatogr B Analyt Technol Biomed Life Sci. 2022;1211:123481. https://doi.org/10.1016/j.jchromb.2022.12348
22. Suzuki J, El-Haddad S. A review: Fentanyl and non-pharmaceutical fentanyls. Drug Alcohol Depend. 2017;171:107–16. https://doi.org/10.1016/j.drugalcdep.2016.11.033
23. Krivorotov DV, Kochura DM, Dulov SA, Radilov AS. Experimental comparing of lipophilicity of opioid antagonists. Toxicological Review. 2022;30(3):149–57 (In Russ.). https://doi.org/10.47470/0869-7922-2022-30-3-149-157
24. Janicka M, Janicka M, Sztanke M, Sztanke K. Reversed-phase liquid chromatography with octadecylsilyl, immobilized artificial membrane and cholesterol columns in correlation studies with in silico biological descriptors of newly synthesized antiproliferative and analgesic active compounds. J Chromatogr A. 2013;1318:92–101. https://doi.org/10.1016/j.chroma.2013.09.060
25. Nikolaev AI, Shkaeva IE, Solnceva SA, Nikulina OS. Calculation of the toxic properties of halogenated hydrocarbons of normal structure according to the physico-chemical parameters of the molecule. Russian Chemical Industry. 2019;96(4):205–11 (In Russ.). EDN: TOOJXY
26. Nikolaev AI, Antonova IN, Donskaja OS, Vladimirova LG. LC-spectra analysis algorithm for non-invasive diagnostics by oropharyngeal washout samples. Medical alphabet. 2019;4(35):23–7 (In Russ). https://doi.org/10.33667/2078-5631-2019-4-35(410)-23-27
Denis V. Krivorotov
Leningrad region
Anatoly I. Nikolaev
Leningrad region
Andrey S. Radilov
Leningrad region
Vladimir R. Rembovsky
Leningrad region
Viktor A. Kuznetsov
Leningrad region
Krivorotov D.V., Nikolaev A.I., Radilov A.S., Rembovsky V.R., Kuznetsov V.A. Physical and chemical criteria for hazard assessment of CNS-active xenobiotics. Extreme Medicine. 2025;27(1):15-25. https://doi.org/10.47183/mes.2025-265
10 bld. 1 Pogodinskaya Str., Moscow, Russia 119121
tel.: +7 (495) 540-61-71, ext.: 4190, 4191, 4192
E-mail: Extrememedicine@cspfmba.ru
Processing of personal data