


Contents
Scroll to:
 P. A. Golubinskaya,
E. S. Ruchko,
A. S. Pikina,
I. P. Smirnov,
T. V. Vladimirova,
V. D. Gordeeva,
G. P. Arapidi,
A. V. Eremeev
P. A. Golubinskaya,
E. S. Ruchko,
A. S. Pikina,
I. P. Smirnov,
T. V. Vladimirova,
V. D. Gordeeva,
G. P. Arapidi,
A. V. Eremeev https://doi.org/10.47183/mes.2025-27-1-97-106
Scroll to:
Introduction. The use of cellular constructs based on human pluripotent stem cells (hPSCs) is associated with a number of challenges, including the need to standardize methods for cultivating chondrocyte-like hPSCs derivatives to produce a cartilage tissue similar to natural hyaline cartilage. Glycosaminoglycans (GAGs) are the basis of the extracellular matrix (ECM) of cartilage tissue; therefore, a qualitative and quantitative analysis of the GAG composition of cartilage-like tissue engineering structures is an important step in the final assessment of their potential therapeutic effectiveness.
Objective. To determine the composition of GAGs synthesized in vitro by chondrocytes of various origins using enzyme-linked immunoassay (ELISA) and liquid chromatography with tandem mass spectrometry (LC–MS/MS), as well as to evaluate the effect of 2D and 3D culturing on their synthesis.
Materials and methods. We analyzed the GAG levels in 2D and 3D tissue-engineered structures obtained from the cartilage tissue of five donors, chondrocyte-like cells differentiated from two hPSC lines. Cellular spheroids were obtained by aggregation in microlunar plates and cultured in mini-bioreactors. The analysis of the GAG content in cell culture samples and spheroids was carried out using ELISA and LC–MS/MS. The Kruskal–Wallis and Dunn tests were used to assess the statistical significance of the differences between the samples.
Results. The ELISA study revealed statistically significant differences (p < 0.0021), confirming higher levels of GAGs synthesized in 3D cultures of native chondrocytes compared to 2D cultures (108.67 ng/mL and 1099.87 ng/mL, respectively). The average number of spectra of the chondroitin sulfate proteoglycan 4 protein, determined using LC–MS/MS, was also higher in 3D cultures, amounting to 41.75 spectra compared to 2.24 spectra in 2D culture samples. The levels of aggrecan, biglican, and decorin did not differ between cultures. 3D cultures of chondrocyte-like cells from hPSC showed no significant differences in the content of GAG compared to 2D cultures, which indicates the need to optimize the conditions for their differentiation.
Conclusions. In our study, the composition of the GAGs synthesized in vitro by chondrocytes of various origins was determined using ELISA and LC–MS/MS. The the effect of 2D and 3D cultivation on their synthesis was evaluated. The results showed that 3D culture media create favorable conditions for a more complete formation of chondrocytic ECM in native chondrocyte samples. Despite this, the obtained spheroids of chondrocyte-like hPSCs derivatives fail to achieve functional identity with natural cartilage tissue, even after completion of differentiation protocols, thus not representing optimal tissue engineering structures for correcting cartilage defects.
Golubinskaya P.A., Ruchko E.S., Pikina A.S., Smirnov I.P., Vladimirova T.V., Gordeeva V.D., Arapidi G.P., Eremeev A.V. Composition analysis of proteoglycans synthesized in vitro by chondrocytes of various origins. Extreme Medicine. 2025;27(1):97-106. https://doi.org/10.47183/mes.2025-27-1-97-106
Chronic joint diseases continue to pose a serious challenge to global health. These diseases impose a significant economic burden due to the prevalence and severity of damage to the musculoskeletal system, as well as the costs associated with treatment and related disabilities. In 2019, about 528 million people worldwide suffered from osteoarthritis, which was by 113% more than in 1990 [1]. The clinical potential of chondrocytes derived from the cartilage tissue of patients has long been recognized. Matrix-induced autologous chondrocyte implantation (MACI) is currently the most common method for treating cartilage deficiency and correcting cartilage defects. This therapeutical method was approved by the US Food and Drug Administration (FDA) in 2016 [2].
MACI technique uses autologous chondrocytes isolated from a biopsy of the cartilage tissue of patients, which are cultured on a 3D matrix of a collagen membrane [3]. However, in some cases, such as under a prolonged use of corticosteroids, nonsteroidal anti-inflammatory drugs, or chemotherapy, sufficient amounts of cellular material cannot be obtained, which is the main limitation of this technique. Human pluripotent stem cells, not only being an unlimited source of cellular material but also not requiring painful surgical intervention, represent the next step in the development of cellular technologies [4]. However, a number of problems associated with the hPSCs use remain unresolved, such as the high cost of their culture and differentiation in the chondrocytic direction, the potential risks of an immune reaction to chondrocytes obtained from hPSCs, and the risks of tumorigenicity and oncogenicity of cell constructs obtained from hPSCs. Progress in solving these problems is inextricably linked to the development of new protocols for differentiation, genetic editing, and culturing of both chondrocytes derived from hPSCs and hPSCs themselves [4].
Cartilage tissue forms on the extracellular matrix (ECM) and a small number of specialized cells known as chondrocytes. The composition and organization of the ECM determine its biomechanical properties. The functional properties of ECM are similar to those of a viscoelastic gel consisting of two main phases: a solid phase comprising collagen fibers, proteoglycans and non-collagen proteins, and a liquid phase consisting of 80% water and electrolytes (Ca2+, K+, Na+, Cl-); the main proteoglycan in cartilage is aggrecan.
Chondrocytes are mechanosensitive cells, whose functional activity depends significantly on the microenvironment [5]. Chondrocytes are located in small cavities referred to as lacunae surrounded by ECM. These structures, known as chondrons [6], form the main structural, functional, and metabolic units of articular cartilage [7] and differ in the composition of collagen fibrils and GAGs. The chondron area is 2–4 µm thick, consisting mainly of proteoglycans and GAGs (perlecan, decorin, biglycan, aggrecan, and hyaluronic acid), as well as type VI collagen [8].
The main proteoglycan of cartilage tissue is aggrecan, which interacts with hyaluronic acid and forms large aggregates that impart shock-absorbing properties to cartilage tissue. A decrease in the content of aggrecan and other proteoglycans in cartilage is associated with the development of osteoarthritis, which leads to deterioration of the mechanical properties of cartilage and disease progression [9]. At the same time, biglycan and decorin are small leucine-rich proteoglycans (SLRP) that play a key role in maintaining the structure and function of cartilage tissue. They are involved in the regulation of collagen fibrillogenesis by interacting with its fibers and influencing the ECM organization. Dekortin, in particular, binds to type II collagen, regulating the size and shape of collagen fibrils thus maintaining the structural integrity of cartilage. Biglycan also interacts with collagen; however, its functions are more diverse: participation in bone mineralization and regulation of cell growth [10]. Chondroitin sulfate-proteoglycan 4 is a membrane proteoglycan involved in adhesion, migration, and intercellular signaling. Although its role in cartilage tissue remains to be understood, it is assumed to affect the interaction of chondrocytes with ECM, supporting the structure and functionality of cartilage. Chondroitin sulfate-proteoglycan 4, is also capable of regulating cell growth and differentiation, rendering it a promising target for osteoarthritis therapy and cartilage tissue regeneration [11].
Enzymatically isolated chondrocytes can produce a new ECM within a few hours after culture in vitro, although no further formation of ECM occurs around the cell [12]. It is believed that the full maturation of ECM takes 2–3 weeks. At the same time, studies have shown that specific conditions are necessary for the full maturation of ECM and the formation of chondrons: the microenvironment and physical factors, such as gravitational and hydrodynamic effects [13], which can be maintained in 3D structures [14]. Spheroidal cell cultures promote improved cell survival and functional activity compared to conventional 2D chondrocyte cultures. These advantages are explained by the ability of 3D structures to more effectively simulate the natural microenvironment, as well as the influence of chemical and physical factors [15]. Conversely, under the conditions of 2D culture, chondrocytes lose their phenotype, demonstrate increased production of type I collagen (associated with fibrous cartilage) and decreased levels of type II collagen (associated with hyaline cartilage), as well as lower levels of GAG. It should be noted that this differentiation phenomenon has not yet been fully studied in chondrocytes obtained from HPSCS.
The GAG composition and content level are the critical characteristics describing the formed chondron. Therefore, when developing cartilage-like tissue engineering structures for regenerative medicine, determining the level of GAG content and composition is essential for assessing the effectiveness and functional activity of the resultant cartilage implant [16]. In addition, the state of chondrocytes and their microenvironment affect the content, properties, and composition of ECM. Chondrocytes obtained from damaged tissues, such as osteoarthritis-affected cartilage, synthesize heparan sulfate with increased sulfation, which is associated with an increased activity of catabolic enzymes such as matrix metallopeptidases (MMP3, MMP13), and a decreased expression of key chondrocyte genes such as type II collagen alpha 1 chain (COL2A1), aggrecan (ACAN), and SRY-box transcription factor 9 (SOX9) [8].
In their study, Lee G. and Loeser R. [12] showed that chondrocytes from the surface and middle/deep areas of cartilage isolated by zonal abrasion exhibit significant differences in GAG content when cultured during the period of four weeks. Hu J. and Athanasiou K. found that chondrocytes from the middle/deep area produced 250% more GAG and collagen in terms of dry weight compared to chondrocytes from the surface area [17]. In addition, chondrocytes of the middle/deep area are capable of forming aggregates and cartilage-like structures, which is favorable for the creation of tissue engineering structures. In another study, Beckers J. et al. [18] found a discrepancy in the synthetic activity of chondrocytes isolated from loaded and unloaded cartilage areas, although these differences decreased when the cells underwent several passaging procedures.
The existing approaches to obtaining cartilage-like cell structures from hPSCs remain to be imperfect, associated with low reproducibility, variability in cell differentiation efficiency, insufficient mechanical strength of the formed tissues, and scaling complexity. GAGs are one of the main components of the ECM of cartilaginous tissue; therefore, a qualitative and quantitative analysis of GAG composition is an important stage in assessing the potential therapeutic efficacy of cartilage-like cellular structures. At the same time, the cultivation conditions that directly affect the resultant GAG content are key to creating effective cellular structures. Cultivation conditions can be modified to obtain tissue samples most similar to hyaline cartilage in their characteristics.
In this study, we aim to determine the composition of GAGs synthesized in vitro by chondrocytes of various origins using enzyme immunoassay (ELISA) and liquid chromatography with tandem mass spectrometry (LC–MS/MS), as well as to evaluate the effect of 2D and 3D cultivation on their synthesis.
Samples of the studied cell cultures were divided into groups (Table 1) according to the criteria of cell origin and type of their culture:
1) The group of 2D cultures of native chondrocytes included samples obtained from patients with gonarthrosis and meniscal neuralgia;
2) The group of 3D cultures of native chondrocytes was also represented by samples from patients with similar diagnoses, but grown under 3D culture conditions;
3) The group of 2D cultures of chondrocytes differentiated from hPSCs included samples obtained from the IPSRG4SAb2m c55/1 and IPSRG4S hPSC cell lines;
4) The group of 3D cultures of chondrocytes differentiated from hPSCs also contained samples obtained from the same cell lines, but under 3D cultivation conditions;
5) The control group of hPSCs consisted of IPSRG4S and IPSRG4SAb2m c55/1 cell lines that did not undergo differentiation into chondrocytes.
Table 1. Distribution of samples into groups for glycosaminoglycan content measurement by ELISA and proteoglycan content measurement by LC-MS/MS
|
ELISA |
LC-MS/MS |
||||
|
Sample group |
Sample number |
Cell culture characteristics |
Sample group |
Sample number |
Cell culture characteristics |
|
2D cultures of native chondrocytes |
5 |
Gonarthrosis — 4 Meniscal neuralgia — 1 |
2D cultures of native chondrocytes |
5 |
Gonarthrosis — 4 Meniscal neuralgia — 1 |
|
3D cultures of native chondrocytes |
2 |
Gonarthrosis — 1 Meniscal neuralgia — 1 |
3D cultures of native chondrocytes |
5 |
Gonarthrosis — 4 Meniscal neuralgia — 1 |
|
2D cultures of chondrocytes differentiated from hPSCs |
2 |
the cell line hPSCs IPSRG4SΔb2m cl55/1 the cell line hPSCs IPSRG4S |
2D cultures of chondrocytes differentiated from hPSCs |
2 |
the cell line hPSCs 4SΔb2m cl55/1 the cell line hPSCs IPSRG4S |
|
3D cultures of chondrocytes differentiated from hPSCs |
2 |
the cell line hPSCs IPSRG4SΔb2m cl55/1 the cell line hPSCs IPSRG4S |
3D cultures of chondrocytes differentiated from hPSCs |
2 |
the cell line hPSCs IPSRG4SΔb2m cl55/1 the cell line hPSCs IPSRG4S |
|
hPSCs control group |
2 |
the cell line hPSCs IPSRG4S the cell line hPSCs IPSRG4SΔb2m cl55/1 |
hPSCs control group |
1 |
the cell line hPSCs IPSRG4S |
Table prepared by the authors using their own data
This sample separation approach enabled a comparative analysis of the effect of different cultivation conditions and cell origin on their characteristics.
Chondrocytes were isolated from biopsies of cartilage tissue of patients who provided their informed consent. Prior to crushing, the cartilage was transferred to a 15 mL tube using a serological pipette and washed once with a Dulbecco’s Modified Eagle Medium DMEM (Thermo Fisher Scientific, USA) supplemented with double the amount of penicillin/streptomycin (200 U/mL, PanEco, Russia). The cartilage was then placed in a sterile 60 mm Petri dish and crushed with sterile scissors and a scalpel in the presence of 4 mL of DMEM medium, to which double the amount of antibiotic was also added. The crushed cartilage was washed in 15 mL of the same medium. The cartilage pieces were then incubated for 40 min in a 15 mL tube on a laboratory orbital shaker (Infors HS Celltron, Switzerland) at 37°C with 5% CO2 using 10 mL of DMEM medium supplemented with double the amount of antibiotic, as well as 10 mg of type IV collagenase (Worthington Biochemical, USA) and 10 mg of type I collagenase (Worthington Biochemical, USA). Following incubation, the cartilage pieces were centrifuged for 5 min at 200 g in a centrifuge (Eppendorf Centrifuge 5804R, Germany). The filler fluid was carefully removed, and the pieces of cartilage were resuspended in DMEM medium and additionally rinsed twice. After that, 10 mL of Dulbecco’s Modified Eagle Medium was added to the cartilage with the addition of a 1:1 F-12 nutrient mixture DMEM/F12 (Thermo Fisher Scientific, USA) supplemented with 20% fetal bovine serum FBS (HyMedia, India), 2 mM Glutamax (Thermo Fisher Scientific, USA) and 100 U/mL of penicillin/streptomycin (PanEco, Russia). The pieces were then transferred to a culture vial T-25 cm2, pretreated with 0.01% gelatin type B solution (PanEco, Russia). Pieces of cartilage were cultured at 37°C with 5% CO2. The culture was passaged until the cell monolayer reached 70% confluent density; the culture medium was replaced every five days.
The IPSRG4S line of induced pluripotent human stem cells was obtained by collaboration of the Cell Biology Laboratory (Lopukhin National Research Center for Biological Medicine, Moscow, Russia) and the Stem Cell Laboratory of the A.I.Virtanen Institute for Molecular Sciences (University of Eastern Finland, Kuopio, Finland) [19]. Later, in the Cell Biology Laboratory of the Lopukhin National Research and Scientific Center of the Russian Academy of Medical Sciences, based on the IPSRG4S hPSC cell line, the IPSRG4SΔb2m cl55/1 hPSC cell line was obtained, in which the beta-2 microglobulin gene was inactivated using CRISPR/Cas9 genomic editing. hPSC was cultured in six-well plates pre-coated with matrigel (BD, USA) on a nutrient medium consisting of mTeSR-1 (STEMCELL Technology, Canada) and Hybris 8 (Paneco, Russia) in a ratio of 1:3.
To induce differentiation, hPSCs were cultured in a DMEM/F12 medium (Thermo Fisher Scientific, USA) supplemented with 10% FBS (HyMedia, India), 2 mM Glutamax (Thermo Fisher Scientific, USA), 100 U/mL penicillin/streptomycin (PanEco, Russia), 10 µM kinase-3 glycogen synthase inhibitor CHIR99021 (Miltenyi Biotec, Germany), and 10 nM retinoic acid (Miltenyi Biotec, Germany). The cells were incubated for two days in a CO2 incubator at 37°C with 5% CO2. After that, the medium was replaced with a DMEM/F12 medium (Thermo Fisher Scientific, USA) supplemented with 10% FBS (HyMedia, India), 2 mM Glutamax (Thermo Fisher Scientific, USA), 100 U/mL penicillin/streptomycin (PanEco, Russia), 10 ng/mL transforming growth factor β (TGF-β) (Miltenyi Biotec, Germany), 10 ng/mL bone morphogenetic protein-2 (BMP-2) (Miltenyi Biotec, Germany), 2% B27 (Thermo Fisher Scientific, USA), 10 µM ascorbic acid (Sigma-Aldrich, USA), and 1% insulin solution-Transferrin-selenite (PanEco, Russia). The cells were cultured for two weeks under the same CO2 incubator conditions. After differentiation, chondrocyte-like derivatives were cultured in a DMEM/F12 medium (Thermo Fisher Scientific, USA) supplemented with 10% FBS (HyMedia, India), 2 mM Glutamax (Thermo Fisher Scientific, USA), 100 U/mL penicillin/streptomycin (PanEco, Russia), 10 ng/mL TGF-β (Miltenyi Biotec, Germany), and 10 ng/mL of BMP-2 (Miltenyi Biotec, Germany).
For the formation of spheroids, chondrocytes were taken, which were on the second passage after isolation of the cell culture from cartilage tissue; chondrocyte-like derivatives of hPSCs were folded into spheroids on the second passage after the onset of the differentiation protocol of hPSCs. By the commencement of chondrocyte differentiation of hPSCs, the IPSRG4S cell line had been located at passage 34, and IPSRG4SΔb2m cells had been located at passage 41. Chondrocyte-like derivatives were removed from six-well plates using 0.05% trypsin solution (Thermo Fisher Scientific, USA), and chondrocytes were removed from T-75 cm2 culture vials using 0.25% trypsin solution (Thermo Fisher Scientific, USA). The cells were washed of trypsin using a DMEM medium (Thermo Fisher Scientific, USA) supplemented with 10% FBS (HyMedia, India) and centrifuged for 5 min at 200 g. The cells were then transferred to an AggreGell800™ plate (STEMCELL Technology, Canada) at a density of 900,000 to 3 million cells per well and cultured in a DMEM/F12 medium (Thermo Fisher Scientific, USA), supplemented with 10% FBS (HyMedia, India) and 10 µM Rho kinase inhibitor Y27632 (Miltenyi Biotec, Germany), by adding 2 mL of the full medium to the well.
The cells were cultured on an AggreGell800™ plate from 12 h to 24 h. After the incubation period, the spheroids were collected from the wells using a 5 mL serological pipette and transferred to a 15 mL tube. They were allowed to precipitate to the bottom of the tube for 2–3 min, after which the filler liquid was discarded. The spheroids were then placed in a freshly frozen undiluted matrigel (BD, USA). Following 30 min, the spheroids were washed by passive settling in a 15 mL tube or careful centrifugation for 1 min at 300 rpm. Subsequently, the spheroids were transferred to homemade mini-bioreactors, which were low-adhesion Petri dishes with a drop of glue in the center. A detailed protocol for creating mini-bioractors was described in a previous study [20]. The mini-bioreactors were placed on an orbital shaker in a CO2 incubator. The rotation speed was set to 70–75 rpm. Following 24 h, the medium was replaced. Later, the environment was changed weekly. After transfer to the bioreactors, the spheroids were cultured for two weeks.
To evaluate the expression of chondrocyte markers, a quantitative reverse transcription polymerase chain reaction was performed according to the previously described protocol [21].
For cell lysis in monolayer cultures and spheroids, an RLT buffer (QIAGEN, Germany) supplemented with 10 µL/mL of β-mercaptoethanol was used. Spheroids (3–5 pieces each, depending on the size) and monolayer cell cultures were pipetted in 600 µL of RLT for lysis. The RNeasy Plus Mini Kit (QIAGEN, Germany) was used to isolate RNA, and a solution of DNA was used for purification from genomic DNA (SibEnzyme, Russia). The synthesis of the first cDNA strand was carried out using an MMLV RT kit (Evrogen, Russia) according to the manufacturer’s protocol. For qPCR, a reaction mixture was prepared: 5 µL of 5×qPCRmix-HS SYBR (Evrogen, Russia), 0.8 µL of 10 µM primer mixture, 18.2 µL of water, then 1 µL of cDNA matrix was added to the wells of a 96-well plate (SSIbio, USA). Amplification was performed on a CFX96 thermal cycler (Bio-Rad, USA) at 39 cycles. cDNA of IPSC samples was used as a negative control to evaluate the specificity of the reaction. The results were analyzed using Microsoft Excel by the ΔΔCt method.
The GAG content in 2D and 3D chondrocyte culture samples was determined using a Human IGG ELISA Kit (FineTest, China). During the cultivation of chondrocytes, aliquots of the medium were selected for analysis. The samples were stored at a temperature of minus 80°C. Each analysis of a biological sample consisted of two repetitions. The optical density was measured at a wavelength of 450 nm using a Tecan Infinite 200 Pro reader. The standard curve was formed in the Curve Expert Basic software by plotting the dependence of the optical density at λ = 450 nm of each standard solution on its corresponding concentration. The target concentration of the samples was interpolated from this standard curve.
For ELISA of 2D cell culture samples, 200,000 to 500,000 chondrocyte cells, chondrocyte-like cPSC derivatives, and 1,500,000 cPSC cells were taken. For ELISA of 3D cell culture samples, 700 thousand cells of chondrocyte spheroids, from 375,000 to 1,000,000 cells of chondrocyte-like derivatives of hPSCs and 1,000,000 cells of hPSC spheroids were taken. For data processing, the values obtained for each sample were normalized depending on the volume of the medium in which the chondrocytes were cultured and the number of cells.
Chondrocytes and chondrocyte-like derivatives from hPSCs were used to create chondrocyte multilayers (2D cartilage-like structures) and 3D spheroids using AggreWell 800™ microlunar plates (STEMCELL Technology, Canada). In addition, 2D and 3D cartilage-like structures were obtained from primary cultures of chondrocytes isolated from patients’ donated biological materials. Samples of cell cultures and 3D structures were subjected to trypsinolysis, liquid chromatography was performed using the Dionex Ultimate 3000 system (Thermo Fisher Scientific, USA) followed by mass spectrometric analysis using an Orbitrap Q Exact HF-X system (Thermo Fisher Scientific, USA).
For LC–MS/MS, 1,000,000 cells were taken for the analysis of 2D cultures and 10 spheroids for the analysis of 3D cell cultures. Prior to the procedure, monolayer cultures were washed three times with phosphate buffer to remove the culture medium followed by separation from the culture dish using a Versene solution. After flushing by centrifugation, the filler liquid was removed and the cells were frozen at minus 70°C before the analysis. The 3D structures were similarly washed with phosphate buffer three times by passive sedimentation. The precipitate was then subjected to the final washing procedure before freezing. After sedimentation, the precipitate was transferred for protein composition analysis by the LC–MS/MS method.
To destroy cellular structures and isolate proteins, a 10% solution of sodium deoxycholate was added to the samples, adjusting to a final concentration of 1%. A mixture of nucleases was then added to degrade the nucleic acids followed by incubation at 4°C for 30 min. Next, tris(2-carboxyethyl)phosphine (5 mM) and chloroacetamide (30 mM) were added to the solution to restore and alkylate disulfide bonds, after which they were incubated at 80°C for 10 min. The proteins were precipitated with methanol-chloroform; the resulting precipitates were resuspended in 100 µL of Tris-HCl buffer (50 mM, pH 8.5). After that, the protein concentration was determined using a BCA Assay Kit (Thermo Fisher Scientific Inc.). Enzymatic protein cleavage was performed with trypsin (Trypsin Gold, Mass Spectrometry Grade, Promega) in the trypsin ratio:protein 1:50 (% w/w), holding samples at 37°C for 16 h. Proteolysis was stopped by adding trifluoroacetic acid to a concentration of 1%. The peptides were then dried using vacuum concentration (SpeedVac, Thermo Fisher Scientific Inc.) and dissolved in 20 µL of a solution containing 3% acetonitrile and 0.1% trifluoroacetic acid in ultra-high purity (mQ) water. Subsequently, the concentration of peptides was determined using a coloristic method followed by assessing protein concentration using bicynchonic acid (BCA analysis).
A Dionex Ultimate 3000 nano-LC system (Thermo Fisher Scientific, Waltham, MA) with a PicoTips C-18 column (length 10 cm, inner diameter 75 µm, New Objective, USA) filled with Kinetex C18 sorbent (2.4 µm, Phenomenex, Torrence, CA) was used for liquid chromatography. The flow was set at 300 nL/min at 60°C. Buffer A consisted of 0.1% formic acid in LC/MS water, and buffer B consisted of 80% acetonitrile, 0.1% formic acid in LC/MS water. The separation was carried out in a gradient mode, increasing the concentration of buffer B from 3% to 40% for 120 min. Mass spectrometric analysis was performed on an Orbitrap Q Exact HF-X (Thermo Fisher Scientific) instrument with a nanospray source (voltage +2.2 kV, capillary temperature 300°C). MS1 scanning was performed in the range of 350–1500 m/z (resolution 60,000, AGC 3e6, injection time 45 ms). HCD with an energy of 30 eV were used for fragmentation. MS2 scanning was performed in the range of 200–2000 m/z (resolution 30,000, AGC 2e5, injection time 50 ms). The dd-MS2 strategy was used with the selection of the 12 most intense ions (Top12).
The raw LC–MS/MS data obtained on the Orbitrap mass spectrometer was converted to mgf format data using the MSConvert software with the following command line parameters: “--mgf --filterpeakPicking true”. For complex identification of proteins, the obtained results were processed using MASCOT and X! Tandem. Tandem mass spectrometry parameters were analyzed using the UniProt Knowledgebase protein sequence database (human taxon) using the ALANINE algorithm with an error tolerance of 20 ppm to determine the precursor mass and 50 ppm to determine the fragment mass. The search parameters were set as follows: protein hydrolysis by trypsin with one possible missing cleavage site, permanent carbamide methylation modification (C), and variable oxidative modification (M). To compare the identification results obtained using MASCOT and X! Tandem, and the compilation of the final list of identified proteins, the results of both identification algorithms were analyzed in the Scaffold 5 software. This algorithm estimated the local frequency of false positive identifications using a standard protein grouping throughout the experiment. To assess the identification error of peptides and proteins, a threshold level of false identification of less than 5% was selected. Differential gene expression was identified using the R limma programming language package.
Statistical analysis of qPCR, ELISA, and LC–MS/MS data was performed using the Bizorender software. The differences between the groups were assessed by the nonparametric Kruskal–Wallis test, which is used for independent samples in which data did not have a normal distribution. When a statistically significant difference was detected (p < 0.05), a multiple Dann comparison test was additionally performed for paired comparisons between the groups, which allowed us to adjust the probability of false positive results. The differences at p < 0.05 were considered statistically significant, while the following symbols were used to indicate the significance levels: * (p < 0.05), △ (p < 0.01), ○ (p < 0.001). To analyze the qPCR data, the Welch t-test was used, which takes into account differences in standard deviations between two groups of independent samples. The differences were considered significant at a statistical significance level of p < 0.05.
The qPCR method was used to confirm the identity of cell cultures of chondrocytes and chondrocytes obtained from hPSCs by analyzing the expression of key molecular markers characteristic of mature cartilage cells.
The results of qPCR confirmed that cell cultures of native chondrocytes exhibit high expression of specific markers such as aggrecan (ACAN), type II collagen (COL2A1), and transcription factor SOX9, which is a key regulator of chondrogenesis (Fig. 1). The graph shows the relative expression values of key chondrocyte genes in cell cultures of native chondrocytes and those obtained from hPSCs. The YWHAZ reference gene was used to normalize expression levels. The columns on the graph reflect the average values of relative normalized gene expression (ΔΔCt) with an indication of the standard deviation (SD). No significant differences were found between the samples of native chondrocytes and chondrocyte-like derivatives of hPSCs analyzed using the Welch t-test. A high level of chondrocyte gene expression indicates the functional maturity of native chondrocyte cell cultures. Chondrocytes obtained from hPSCs also showed a pronounced expression of these markers, which indicates a high degree of their differentiation into cartilage cells similar to native chondrocytes.
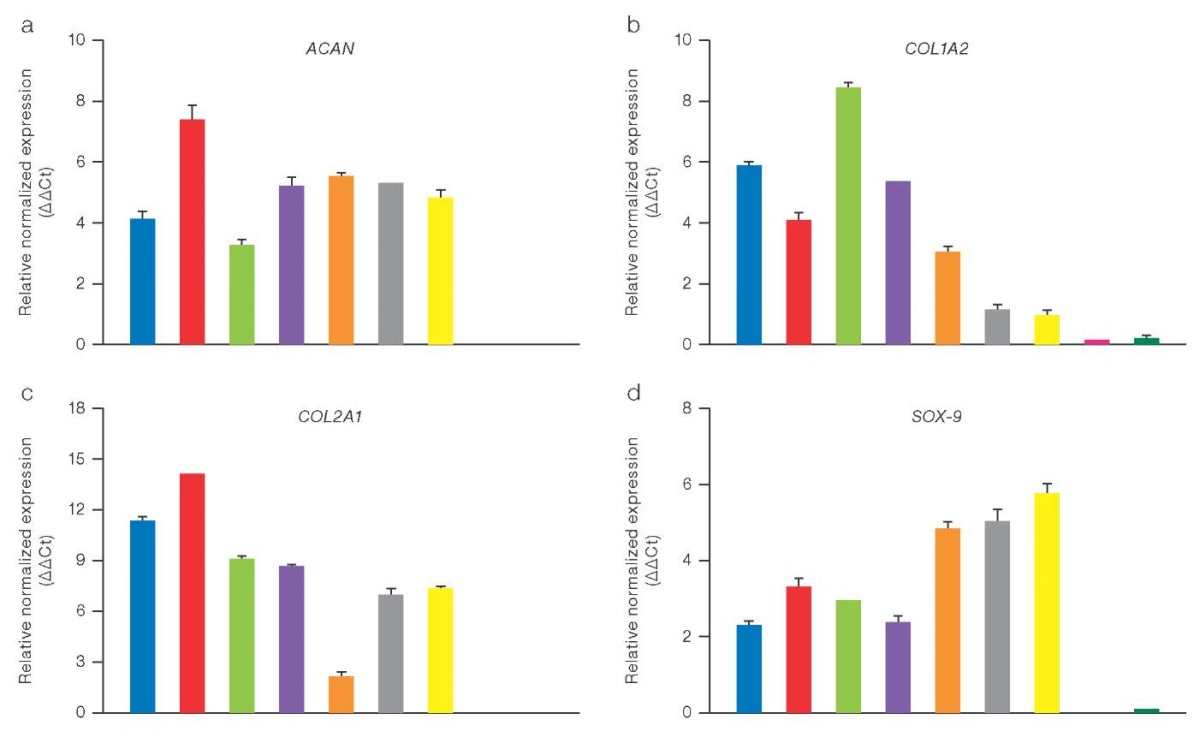
Figure prepared by the authors using their own data
Fig. 1. Relative expression of chondrocyte genes (ΔΔCt), normalized for the YWHAZ gene, in 2D samples of chondrocyte cultures of various origins, measured by the qPCR method
Note: a. Aggrecan (ACAN); b. Alpha-2 chain of type I collagen (COL1A2); c. Alpha-1 chain of type II collagen (COL2A1); d. Transcription factor SOX-9; color matching in the diagram to the samples under study: blue — chondrocytes of patient 76; red — chondrocytes of patient 75; green — chondrocytes of patient 47; purple — chondrocytes of patient 44; brown — chondrocytes of patient 12; gray — chondrocyte-like cells differentiated from hPSC IPSRG4SΔb2m cl55/1; yellow — chondrocyte-like cells differentiated from hPSC IPSRG4S; purple — hPSC IPSRG4SΔb2m cl55/1; dark green — hPSC IPSRG4S.
The conducted quantitative analysis of GAG using ELISA revealed that the content of these biopolymers is significantly higher in 3D cultures of chondrocytes compared to those in 2D cultures. In particular, the concentration of GAGs in 3D cultures of native chondrocytes reached 1,099.87 ng/mL, which was significantly higher than the level recorded in 2D cultures (108.67 ng/mL). A similar trend was observed in chondrocyte cultures obtained from hPSCs; however, the GAG content remained lower compared to native chondrocytes, which may indicate the need for additional optimization of differentiation conditions and prolongation of the cultivation period; the corresponding data are presented in Fig. 2.
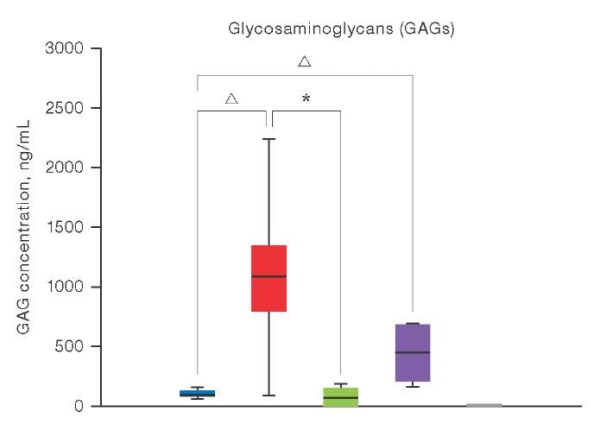
Figure prepared by the authors using their own data
Fig. 2. Results of quantitative determination of GAG by ELISA in chondrocyte cultures under 2D and 3D conditions
Note: the colors in the diagram correspond to the studied samples: blue — 2D cultures of patients’ chondrocytes (n = 5); red — 3D cultures of patients’ chondrocytes (n = 2); green — 2D cultures of patients’ chondrocytes differentiated from hPSC (n = 2); purple — 2D cultures of patients’ chondrocytes differentiated from hPSC (n = 2); gray is the control group of hPSC (n = 2); the level of GAG expression in hPSC cultures is zero; levels of statistical significance compared with the control group: * — p < 0.0332; △ — p < 0.0021.
The phenomenon of chondrocyte dedifferentiation in 2D conditions is well documented [25][26]. It was shown that the cultivation of chondrocyte spheroids in 3D media enhances the process of chondrogenic differentiation, allowing for the production of chondrogenic cell constructs without the need for scaffolding or multiple cell passaging [27][28]. However, a quantitative assessment of the GAG content was not provided in this context.
LC–MS/MS analysis was used to explore the ECM composition. Glycosaminoglycans (GAGs) were found to comprise chondroitin sulfate proteoglycan 4 as the main component, the level of which was significantly higher in 3D cultures of native chondrocytes. This indicates favorable conditions for the production of key components for the cartilage matrix. At the same time, the content of other proteoglycans, such as aggrecan, biglycan, and decorin, remained unchanged.
Figure 3 presents the results obtained when investigating the composition of GAGs synthesized in cultures of chondrocytes of various origins using the LC–MS/MS method. The graph shows the quantitative content of various types of GAGs, including chondroitin sulfate-proteoglycan 4, aggrecan, biglycan, and decorin, in 2D and 3D cultures of native chondrocytes and chondrocytes obtained from hPSC. The data is presented as averages with a standard deviation (SD). Significant differences between the groups were assessed using statistical criteria.
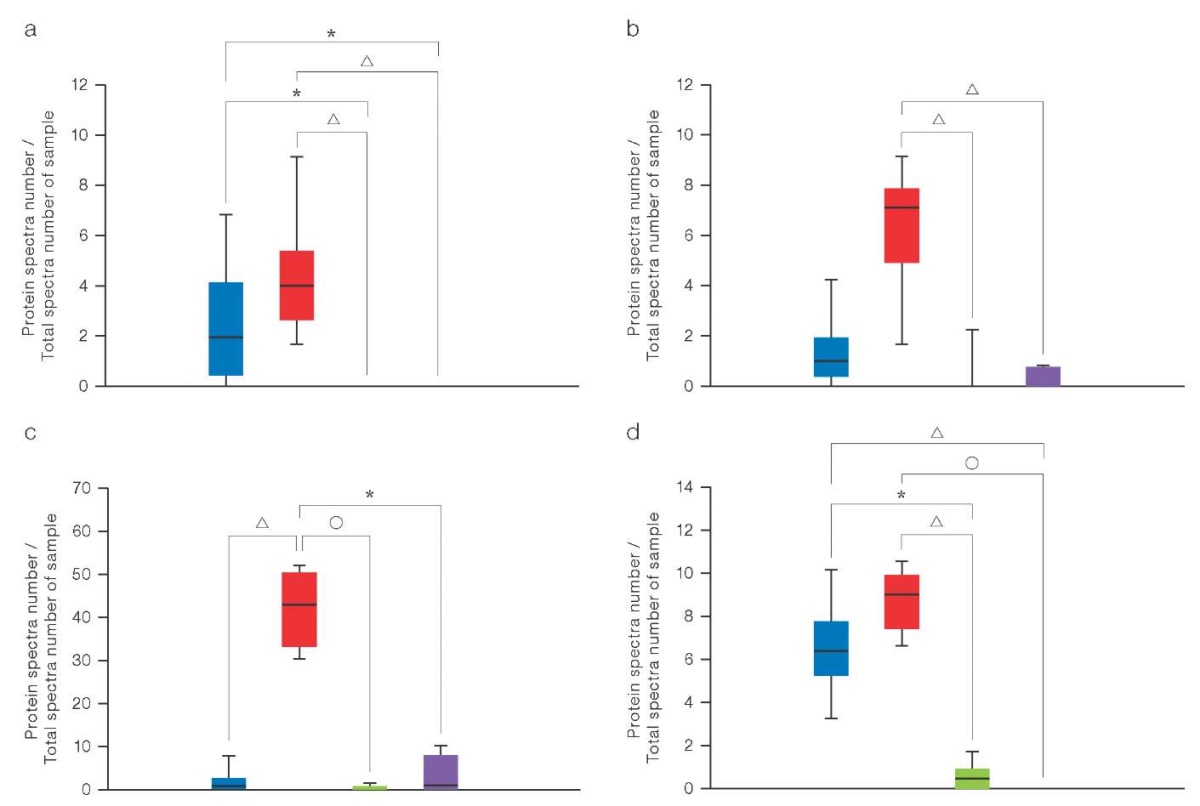
Figure prepared by the authors using their own data
Fig. 3. Composition analysis of GAGs by the LC–MS/MS method
Note: a. Aggrecan; b. Biglycan; c. Chondroitin sulfate proteoglycan 4; d. Decorin; color matching in the diagram to the studied samples: blue — 2D cultures of patients’ chondrocytes (n = 5); red — 3D cultures of patients’ chondrocytes (n = 5); green — 2D cultures of patients’ chondrocytes differentiated from hPSCs (n = 2); purple — 2D cultures of patients’ chondrocytes differentiated from hPSCs (n = 2); gray — hPSCs control group (n = 1); the level of proteoglycan expression in hPSCs cultures is zero; levels of statistical significance compared with the hPSCs control group: * — p < 0.0332; △ — p < 0.0021; ○ — p < 0.0001.
The composition of GAGs determined using LC–MS/MS showed an increased level of their content in 3D cultures of native chondrocytes compared to that in 2D cultures (Fig. 3). Chondrocyte spheroids obtained from the biopsies of patients’ tissues showed a significantly higher concentration of chondroitin sulfate proteoglycan 4. At the same time, 3D cultures of chondrocyte-like derivatives of hPSC demonstrated a low level of all the studied GAGs, which indicates their immaturity even after differentiation. This limitation can potentially be eliminated by extending the cultivation period and supplementing the medium with factors that stimulate the metabolic pathways of GAG synthesis, such as TGF-β, SOX9, bone morphogenetic proteins, and retinoic acid signaling pathways.
In this study, we investigated the composition of GAGs synthesized in vitro by chondrocytes of various origins using ELISA and LC–MS/MS and evaluated the effect of 2D and 3D cultivation on their synthesis. According to the results obtained, the conditions of 3D culture are favorable for a more complete formation of chondrocyte ECM in native chondrocyte samples. Nevertheless, the obtained spheroids of chondrocyte-like derivatives of hPSCs fail to achieve functional identity with natural cartilage tissue, even following completion of differentiation protocols, thus not representing optimal tissue engineering structures for correcting cartilage defects. For a more complete maturation in CM and an increase in their potential effectiveness as structures for tissue engineering, longer cultivation in 3D conditions may be required.
1. GBD 2019 Diseases and Injuries Collaborators. Global burden of 369 diseases and injuries in 204 countries and territories, 1990-2019: a systematic analysis for the Global Burden of Disease Study 2019. Lancet. 2020;396(10258):1204–22. https://doi.org/10.1016/S0140-6736(20)30925-9
2. Carey JL, Remmers AE, Flanigan DC. Use of MACI (autologous cultured chondrocytes on porcine collagen membrane) in the United States: preliminary experience. Orthopaedic Journal of Sports Medicine. 2020;8(8):e2325967120941816. https://doi.org/10.1177/2325967120941816
3. Dekker TJ, Aman ZS, DePhillipo NN, Dickens JF, Anz AW, LaPrade RF. Chondral Lesions of the Knee: An evidence-based approach. Journal of Bone And Joint Surgery. 2021;103(7):629–45. https://doi.org/10.2106/JBJS.20.01161
4. Ali E, Smaida R, Meyer M, Ou W, Li Z, Han Z, et al. iPSCs chondrogenic differentiation for personalized regenerative medicine: a literature review. Stem Cell Res Ther. 2024;15(1):e185. https://doi.org/10.1186/s13287-024-03794-1
5. Li M, Xiao R, Li J, Zhu Q. Regenerative approaches for cartilage repair in the treatment of osteoarthritis. Osteoarthritis and Cartilage. 2017;25(10):1577–87. https://doi.org/10.1016/j.joca.2017.07.004
6. Szirmai JA, ed. The concept of the chondron as a biomechanical unit. In F. Hartmann. Biopolymere und Biomechanik von Bindegewebssystemen. Heidelberg: Springer-Verlag Berlin; 1974. https://doi.org/10.1007/978-3-642-65963-8_9
7. Wang Q, El Haj A, Kuiper N. Glycosaminoglycans in the pericellular matrix of chondrons and chondrocytes. J Anat. 2008;213(3):266–73. https://doi.org/10.1111/j.1469-7580.2008.00942.x
8. Sophia Fox J, Bedi A, Rodeo S. The basic science of articular cartilage: structure, composition, and function. Sports Health. 2009;1(6):461–8. https://doi.org/10.1177/1941738109350438
9. Roughley PJ, Mort JS. The role of aggrecan in normal and osteoarthritic cartilage. J exp ortop. 2014;1:e8. https://doi.org/10.1186/s40634-014-0008-7
10. Han B, Li Q, Wang C, Chandrasekaran P, Zhou Y, Qin L, et al. Differentiated activities of decorin and biglycan in the progression of post-traumatic osteoarthritis. Osteoarthritis Cartilage. 2021;29(8):1181–92. https://doi:10.1016/j.joca.2021.03.019
11. Tang F, Lord MS, Stallcup WB, Whitelock JM. Cell surface chondroitin sulphate proteoglycan 4 (CSPG4) binds to the basement membrane heparan sulphate proteoglycan, perlecan, and is involved in cell adhesion. J Biochem. 2018;163(5):399–412. https://doi.org:10.1093/jb/mvy008
12. Lee G, Loeser R. Interactions of the chondrocyte with its pericellular matrix. Cells Mater. 1998;8:135–49.
13. Vonk L, Roël G, Hernigou J, Kaps C, Hernigou P. Role of Matrix-Associated Autologous Chondrocyte Implantation with Spheroids in the Treatment of Large Chondral Defects in the Knee: A Systematic Review. Int J Mol Sci. 2021;22(13):e7149. https://doi.org/10.3390/ijms22137149
14. Prittinen J, Ylärinne J, Piltti J, Karhula S, Rieppo L, Ojanen S, et al. Effect of centrifugal force on the development of articular neocartilage with bovine primary chondrocytes. Cell Tissue Res. 2019;375(3):629–39. https://doi.org/10.1007/s00441-018-2938-3
15. Caron MM, Emans PJ, Coolsen MM, Voss L, Surtel DA, Cremers A, et al. Redifferentiation of dedifferentiated human articular chondrocytes: comparison of 2D and 3D cultures. Osteoarthritis Cartilage. 2012;20(10):1170–8. https://doi.org/10.1016/j.joca.2012.06.016
16. Study of the composition of glycosaminoglycans synthesized by chondrocytes of different origins in vitro. Abstracts of the 77th International School-Conference of Young Scientists «BIOSYSTEMS: Organization, Behavior, Control». Nizhny Novgorod; 2024 (In Russ.). EDN: QOPJWI
17. Hu J, Athanasiou K. Chondrocytes from different zones exhibit characteristic differences in high density culture. Connect Tissue Res. 2006;47(3):133–40. https://doi.org/10.1080/03008200600685392
18. Bekkers J, Saris D, Tsuchida A, van Rijen M, Dhert W, Creemers L. Chondrogenic potential of articular chondrocytes depends on their original location. Tissue Eng. 2024;20(3–4):663–71. https://doi.org/10.1089/ten.TEA.2012.0673
19. Sodhi H, Panitch A. Glycosaminoglycans in Tissue Engineering: A Review. Biomolecules. 2021;11(1):e29. https://doi.org/10.3390/biom11010029
20. Holmqvist S, Lehtonen Š, Chumarina M, Puttonen K, Azevedo C, Lebedeva O, et al. Creation of a library of induced pluripotent stem cells from Parkinsonian patients. NPJ Parkinsons Dis. 2016;2:e16009. https://doi.org/10.1038/npjparkd.2016.9
21. Eremeev A, Belikova L, Ruchko E, Volovikov E., Zubkova O., Emelin A., et al. Brain Organoid Generation from Induced Pluripotent Stem Cells in Home-Made Mini Bioreactors. J Vis Exp. 2021;178:e62987. https://doi.org/10.3791/62987
22. Barinova AA, Pikina AS, Golubinskaya PA, Ruchko ES, Yeremeyev AV. In vitro assessment of the immunogenicity of chondrocytes derived from B2M knockout-induced pluripotent stem cells. Extreme Medicine. 2024;26(1):32–42 (In Russ.). https://doi.org/10.47183/mes.2024.001
23. Yishan C, Yu Y, Wen Y, Chen J, Lin J, Sheng Z, et al. A high-resolution route map reveals distinct stages of chondrocyte dedifferentiation for cartilage regeneration. Bone Res. 2022;10:e38 https://doi.org/10.1038/s41413-022-00209-w
24. Ma B, Leijten JC, Wu L, Kip M, van Blitterswijk CA, Post JN, Karperien M. Gene expression profiling of dedifferentiated human articular chondrocytes in monolayer culture. Osteoarthritis and Cartilage. 2013;21(4):599–603. https://doi.org/10.1016/j.joca.2013.01.014
25. Vakhrushev IV, Basok YB, Baskaev KK, Novikova VD, Leonov GE, Grigoriev AM, et al. Cartilage-Specific Gene Expression and Extracellular Matrix Deposition in the Course of Mesenchymal Stromal Cell Chondrogenic Differentiation in 3D Spheroid Culture. Int. J. Mol. Sci. 2024;25:e5695. https://doi.org/10.3390/ijms25115695
26. Yen BL, Hsieh CC, Hsu PJ, Chang CC, Wang LT, Yen ML. Three-Dimensional Spheroid Culture of Human Mesenchymal Stem Cells: Offering Therapeutic Advantages and In Vitro Glimpses of the In Vivo State. Stem Cells Translational Medicine. 2023;12(5):235–44. https://doi.org/10.1093/stcltm/szad011
Polina A. Golubinskaya
Moscow
Evgeny S. Ruchko
Moscow
Arina S. Pikina
Moscow
Igor P. Smirnov
Moscow
Tatiana V. Vladimirova
Moscow
Veronika D. Gordeeva
Moscow
Georgiy P. Arapidi
Moscow
Artem V. Eremeev
Moscow
Golubinskaya P.A., Ruchko E.S., Pikina A.S., Smirnov I.P., Vladimirova T.V., Gordeeva V.D., Arapidi G.P., Eremeev A.V. Composition analysis of proteoglycans synthesized in vitro by chondrocytes of various origins. Extreme Medicine. 2025;27(1):97-106. https://doi.org/10.47183/mes.2025-27-1-97-106
10 bld. 1 Pogodinskaya Str., Moscow, Russia 119121
tel.: +7 (495) 540-61-71, ext.: 4190, 4191, 4192
E-mail: Extrememedicine@cspfmba.ru
Processing of personal data