


Contents
Scroll to:
https://doi.org/10.47183/mes.2025-286
Scroll to:
Introduction. The dose assessment of internal irradiation of red bone marrow (RBM) by osteotropic radionuclides is based on dosimetric modeling using computational phantoms. Creating such phantoms for 89.90Sr requires careful description of the shape and size of bones, as well as their microarchitecture. Descriptions of phantoms representing newborn, one-year-old, 5-year-old, and 10-year-old children have been published. Our study continues work on creating a set of computational skeletal phantoms for people of different ages.
Objective. Development of computational skeletal phantoms of male and female adults for estimating radiation doses of beta-emitting radionuclides incorporated in RBM.
Materials and methods. The stochastic parametric skeletal dosimetry (SPSD) method of creating phantoms was used. The skeletal sections with active hematopoiesis were divided into segments. On the basis of literature data, the parameters of segment models were evaluated: linear dimensions, cortical layer thickness, bone microarchitecture characteristics, density, chemical composition, and RBM proportion.
Results. The developed phantoms of male and female adults are composite, including 46 segments each; the parameters of 21 segments were independent of sex. The sizes of segment phantoms range within 4–66 mm; the cortical layer thickness ranges within 0.3–2.2 mm. The parameters of bone segment microarchitecture are presented.
Conclusions. The resulting phantoms simulate the microand macro-architecture of bone tissue, and, together with sets of additional phantoms, represent the population variability of individual skeletal bones and take sex differences into account. The developed phantoms can be used for internal dosimetry of osteotropic beta-emitters, including as part of radiopharmaceuticals.
Sharagin P.A., Tolstykh E.I., Shishkina E.A. Computational phantom for red bone marrow dosimetry in adult males and females. Extreme Medicine. 2025;27(2):220-228. https://doi.org/10.47183/mes.2025-286
Strontium isotopes accumulate in mineralized bone tissue and locally irradiate red bone marrow, which can lead to an increased risk of leukemia. 89.90Sr isotopes were the main source of RBM radiation for residents of the coastal areas of the Techa River, contaminated with radionuclides in the 1950s as a result of radioactive effluents from the Mayak Production Association [1–4]. These radionuclides were also released into the environment as part of global fallout from nuclear weapons tests. In this context, the strontium isotope internal dosimetry of RBM represents a highly significant research task.
The assessment of RBM radiation doses caused by 89.90Sr in the population of the coastal areas of the Techa River includes the use of biokinetic and dosimetric models. The biokinetic model for strontium isotopes developed at the Urals Research center for Radiation Medicine (URCRM) simulates the processes of exchange and transport of these radionuclides in the human body, thus allowing estimation of their specific activity in bone tissue (Bq/g). A dosimetric model is being developed to estimate the coefficients of transition from the specific activity of a radionuclide in bone tissue to the absorbed dose rate in RBM (Gy/s) [4]. Dosimetric modeling involves the use of computational phantom models that simulate the geometry and chemical composition of media in which radiation transfer is assumed, i.e., bone and RBM [5]. Creating such phantoms for beta emitters is a challenging task, due to strict requirements on the description of both the linear dimensions of bones and their microstructure.
The latest computational phantoms are based on the analysis of computed tomography (CT) images of skeletons of deceased people [5–10]1. Such phantoms are difficult to perform and, due to the limited amount of autopsy material, are not sufficiently informative with regard to population variations in the size and microarchitecture of the skeleton [11]. As an alternative, URCRM specialists proposed an original parametric method for stochastic modeling of bone structures — stochastic parametric skeletal dosimetry (SPSD) modeling [11], suitable for internal dosimetry of 89.90Sr. The parameters of SPSD phantoms are based on a large number of published bone measurement results. This makes it possible to assess the variability of skeletal characteristics within population groups and the associated DF variability, which is extremely important for dosimetric support of studies among the irradiated population of the coastal areas of the Techa River. The adequacy of the model is confirmed by a good convergence of the calculated energy dependencies for SPSD phantoms and those presented in the literature [11–13].
Previous studies reported the parameters of skeletal phantoms representing newborn, one-year-old, 5-year-old, and 10-year-old children [14–17]. The skeleton of a 15-year-old child, as well as various characteristics of the simulated areas, are similar to those of an adult, whose skeleton has been described in greater detail in previous research. Therefore, we decided first to model the skeleton of an adult and then to model the skeleton of a 15-year-old child on its basis. It should be noted that sex differences in skeletal characteristics should be taken into account for the purposes of dosimetric modeling.
Our study continues work on the creation of computational phantoms for different age groups. In the present research, we aim to develop computational skeletal phantoms representing an adult male and an adult female to estimate doses of beta-emitting radionuclides incorporated in RBM.
The stages of creating computational phantoms for adults did not differ from those for younger age groups [11] and included:
PET data were used to assess the distribution of RBM within the adult skeleton and to identify the main hematopoietic sites on this basis [18]. This method is more accurate than MRI scanning, the results of which were used to analyze the RBM distribution inside the skeleton for younger age groups [19]. Hematopoietic sites are whole bones or sets of bones, they may include areas without RBM. In order to establish the presence of RBM in a particular site of a particular hematopoietic site, published MRI data were used [20–25].
The parameters of the phantoms included the average values of bone microarchitecture characteristics, including the thickness of the trabeculae (Tb. Th.), the size of the intertrabecular space (Tb. Sp.), the bone tissue proportion in the bone volume (BV/TV) [26], the thickness of the cortical layer (Ct. Th.), and the linear dimensions of the bones.
The set of published data used to estimate the phantom parameters, as well as the methodology for their collection and analysis, were described in detail earlier [26]. To assess the parameters of adult phantoms, bone measurements published in peer-reviewed publications, atlases, monographs, and dissertations were used, as well as electronic resources containing collections of X-ray images. The measurement results of people/samples identified by the authors as healthy and free of diseases leading to bone deformity were used for analysis. In cases where the published data were unavailable, bone measurements from the anatomical collections of the South Ural State Humanitarian Pedagogical University and the South Ural State Medical University were used to obtain characteristics of a specific area of the skeleton. These bones were undamaged and were not divided into groups according to sex. The measurements were carried out by the staff of the URCRM biophysical laboratory using micrometers (REXANT MK 12-9110-2, China).
The analysis used bone measurements from people belonging to ethnic groups typical of the Ural region: Caucasoid and Mongoloid aged 20 to 50 years for females and from 20 to 60 years for males.
The characteristics of the bone microarchitecture required for SPSD modeling included: the thickness of the trabeculae (Tb. Th.), the size of the intertrabecular space (Tb. Sp.), and the bone tissue proportion in the bone volume (BV/TV) [26]. These characteristics were evaluated based on the results of studies obtained using histomorphometry and micro-CT (computed microtomography). To assess the thickness of the cortical bone layer, published measurement results using CT, micro-CT, and micrometers were used. The linear dimensions of bones were estimated based on published measurement results using anatomical boxes, ultrasound and X-ray examinations, as well as computed tomography (CT).
In the absence of sex differences in the studied bone characteristics, the data sets for both sexes were combined. In this case, the bone section was modeled regardless of sex. In other cases, the phantoms for males and for females were modeled separately.
The skeletal areas with active hematopoiesis were divided into smaller segments. Each segment not only has a uniform microarchitecture and thickness of the cortical bone layer, but is also described by a simple geometric shape. A basic phantom of bone segment (BPS) was modeled for each such site [27]. This segmentation allowed us to take into account the heterogeneous microarchitecture inside the bone and the thickness of the cortical layer. The reduction of the phantom size by their separation allowed us to increase their resolution, thus improving the accuracy of modeling.
The linear dimensions and parameters of bone microarchitecture were determined separately for each segment as the mean values of bone characteristics [26].
The density and chemical composition of the simulated media (mineralized bone and bone marrow) were the same for all BPS, being estimated based on literature sources [28][29].
The generation of BPS was carried out in the Trabecula software [30]. The BPS consists of voxel cubes, which, depending on their position, simulate one of the simulated environments.
It should be noted that further dosimetric modeling considered the trabecular (TB) and cortical bone (CB) as separate source tissues, although in the BPS they are modeled by voxels simulating mineralized bone tissue. The bone marrow was considered as a single target tissue [30]. TB is a 3D net (bone strands) of trabeculae, the thickness and relative position of which are determined randomly within the variability of microarchitecture parameters inside the simulated bone [30], estimated on the basis of published data [31–35]. This method of modeling trabeculae took their heterogeneity into account, thereby bringing the model closer to the structure of an actual bone. The bone marrow (BM) fills the space between the trabeculae, and the CB covers the BPS from the outside with a continuous layer with a thickness equal to Ct. Th. The voxel resolution for each BPS was selected separately, the voxel size did not exceed 70% Tb. Th. ranging within 50–140 µm [30]. The volumes of TB, CB, and BM were automatically calculated in the Trabecula software.
Figure 1 shows the main hematopoietic sites of an adult, the bone division into segments, as well as sections of simulated BPS using the femoral bone of an adult male as an example.
One important advantage of the SPSD methodology consists in the possibility to estimate the uncertainty of DF. To that end, for each BPS generated with parameter mean values, 12 supplementary phantoms of bone segment (SPS) were created with randomly selected parameters of the micro- and macrostructure of bone within their individual variability (within the limits of the minimum and maximum measured values). A method for estimating uncertainties when applying the SPSD approach was described in detail earlier [36].
The hematopoietic sites of the adult human skeleton, as well as the mass fraction of RBM therein, were determined according to PET results [18] and presented in Table 1.
Table 1 shows that the adult skeleton includes 12 hematopoietic sites. The RBM mass fraction in these sites varies from 1.8% to 23.2%. The RBM distribution within each hematopoietic site was taken from published MRI data [20–25]. No sex differences were found in the RBM distribution.
The data of the International Commission on Radiation Protection [28] for adults were used to determine the chemical composition of the simulated media; the corresponding data are presented in Table 2.
The density of mineralized bone tissue was estimated based on the published measurements of adult cortical bone density (regardless of sex), being equal to 1.9 g/cm3 [29]. The density of red bone marrow was assumed to be equal to the density of adipose tissue (0.98 g/cm3) [28].
According to a review of published data [26], there are no significant sex differences in the characteristics of the bone microarchitecture; therefore, the data of males and females were combined. Table 3 shows the parameters of the BPS microarchitecture for male and female adults.
The creation of a realistic model for a 3D trabecular network requires evaluation of the variability of the microarchitecture characteristics inside the bone. Concerning this characteristic, we found published data only for the bones of the pelvis, spine, and skull. The mean value of the variability among the indicated regions was used to generate the remaining phantoms. The values of variability within the bone, accepted for different parts of the adult skeleton, are shown in Table 4.
Table 5 shows the linear dimensions and thickness of the cortical layer adopted for adult male and female BPS. The data on which these parameters are based can be found in [26].
Conversely, for a number of adult bones, the parameters of bone microstructure demonstrated significant sex differences in linear sizes. Therefore, for these areas, the sizes were estimated separately for males and females.
The SPSD skeletal phantoms of male and female adults are composite, consisting of 71 BPS. Out of the latter, 25 segments are specific to males, another 25 for females, and 21 segments were modeled identically for both sexes, as shown in Table 5.
The largest number of phantoms in a single hematopoietic site was determined for the sacrum — 10, while the skull and humerus each contain one BPS.
As far as the phantoms of younger age groups are concerned [14–17], most of the adult BPS are cylinders and rectangular parallelepipeds, the linear dimensions of which ranged from 4 mm to 66 mm. The greatest sex differences in linear size were observed for the lower part of the upper branch of the pubic bone (the area of the pubic symphysis), amounting to 66%. The lowest value of the cortical layer thickness was determined for BPS of the cervical vertebrae (0.3 mm), being more than sevenfold different from the maximum value assumed for the proximal end of the femur (2.2 mm). The parameters of the BPS microarchitecture also varied widely. The BV/TV value ranges from 6% to 52%, Tb. Th. — from 0.1 mm to 0.29 mm, Tb. Sp. — from 0.5 mm to 2.37 mm (Table 3).
The population variability of BPS linear sizes comprises 12%, on average; the highest value of variability is estimated for the lower branch of the pubic bone (36%), and the lowest — for the bodies of the cervical vertebrae (3%). The variability in the cortical bone layer thickness ranged from 2% (cervical vertebrae) to 50% (lumbar vertebrae), averaging 20%. The variability of the microstructure parameters ranged from 7% to 65%, averaging 18%.
The obtained values of the variability of phantom parameters were used to generate an SPS. The SPS volume ranged within 23–264% of the BPS volume.
Table 1. RBM mass fraction (% of the RBM total mass in the skeleton) in the main hematopoietic sites of the adult skeleton
|
No. |
Hematopoietic site |
RBM mass fraction, % |
|
1 |
Femur |
5.9 ± 2.5 |
|
2 |
Humerus |
3.6 ± 1.9 |
|
3 |
Sacrum |
7.4 ± 1.8 |
|
4 |
Pelvic bones |
23.2 ± 3.0 |
|
5 |
Skull |
6.2 ± 2.3 |
|
6 |
Clavicle |
0.8 ± 0.01 |
|
7 |
Scapula |
4.7 ± 0.8 |
|
8 |
Ribs |
9.8 ± 1.7 |
|
9 |
Sternum |
1.8 ± 0.7 |
|
10 |
Cervical vertebrae |
3.5 ± 1.0 |
|
11 |
Thoracic vertebrae |
17.5 ± 2.4 |
|
12 |
Lumbar vertebrae |
15.5 ± 2.5 |
Table prepared by the authors using their own data [18]
Note: the data are presented in the form of a mean value (M) and a standard deviation (σ); the source [18] shows the RBM total proportion in the collarbones, shoulder blades, and ribs equal to 15.3 ± 2.6%; the RBM proportion in each of these areas is calculated in proportion to the total volume of BPS (calculated automatically in the Trabecula software), the constituents of each hematopoietic site.
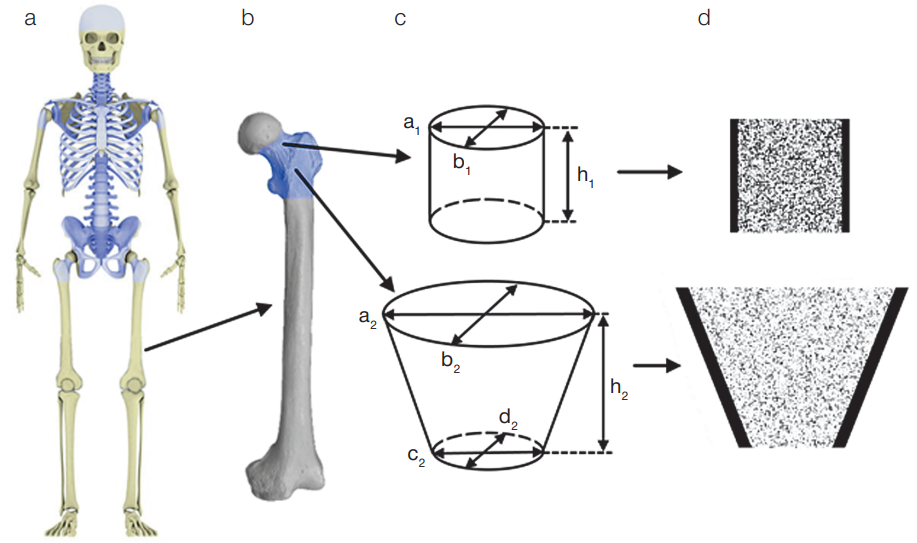
Figure prepared by the authors
Fig. 1. Hematopoietic sites of the adult human skeleton and their segmentation using the femoral bone of an adult male as an example
Note: а) skeleton of an adult male (simulated areas of the skeleton with active hematopoiesis are highlighted in blue); b) femur (simulated areas of the skeleton with active hematopoiesis are highlighted in blue); c) bone separation scheme into BPS and their linear parameters; d) femoral BPS in the voxel representation in the section (voxels are shown in black, imitating mineralized bone, white — BM).
Table 2. Chemical composition of the simulated media, accepted for all BPS
|
Chemical composition, relative units |
||
|
Chemical element |
Bone |
Bone marrow |
|
H |
0.035 |
0.105 |
|
C |
0.16 |
0.414 |
|
N |
0.042 |
0.034 |
|
O |
0.445 |
0.439 |
|
Na |
0.003 |
0.001 |
|
Mg |
0.002 |
0.002 |
|
P |
0.095 |
0.002 |
|
S |
0.003 |
0.002 |
|
Ca |
0.215 |
0 |
Table prepared by the authors using data from [28]
Table 3. Bone microarchitecture parameters adopted for adult BPS
|
Hematopoietic site |
BV/TV, %1 |
Tb. Th., mm2 |
Tb. Sp., mm2 |
|
Femur (neck) |
17 (14–22) |
0.19 (19) |
0.78 (13) |
|
Femur trochanter area |
11 (8–13) |
0.136 (65) |
0.99 (20) |
|
Humerus |
6 (1–13) |
0.1 (18) |
2.37 (25) |
|
Ribs |
12 (5–25) |
0.14 (12) |
0.82 (11) |
|
Ilium |
19 (11–25) |
0.13 (15) |
0.6 (20) |
|
Ishium bone and pubic ramus inferior |
25 (23–27) |
0.3 (7) |
1.0 (40) |
|
Pubic ramus superior |
17 (12–23) |
0.29 (10) |
1.0 (12) |
|
Skull |
52 (41–65) |
0.29 (32) |
0.57 (35) |
|
Clavicle body |
13 (8–18) |
0.19 (13) |
0.8 (25) |
|
Clavicle ends |
29 (15–46) |
0.14 (31) |
0.8 (25) |
|
Scapula |
22 (9–47) |
0.24 (42) |
0.96 (23) |
|
Sternum |
15 (8–22) |
0.15 (29) |
1.4 (9) |
|
Cervical vertebrae |
21 (16–28) |
0.15 (14) |
0.5 (10) |
|
Thoracic vertebrae |
15 (11–28) |
0.1 (15) |
0.6 (15) |
|
Lumbar vertebrae + Sacrum |
16 (11–28) |
0.15 (15) |
0.6 (15) |
Table prepared by the authors using data from [26]
Note: 1the range of possible values is parenthetic; 2the coefficient of variation (CV) in % is parenthetic.
Table 4. Variability of microarchitecture parameters inside the bone
|
Hematopoietic site |
Tb. Th. |
Tb. Sp. |
Data source |
|
Pelvic bones |
10 |
10 |
[25] |
|
Vertebrae and Sacrum |
48 |
43 |
[26] |
|
Skull |
8 |
15 |
[27–29] |
|
Other bones (mean value) |
22 |
23 |
[26–30] |
Table prepared by the authors using data from [25–30]
Note: data is presented in %.
Table 5. Linear dimensions and thickness of the cortical layer accepted for adult BPS
|
Hematopoietic site |
Segment |
Shape1 |
Sex |
Phantom parameters, mm (parenthetic CV, %)2 |
|||||
|
h |
a |
b |
c |
d |
Ct. Th. |
||||
|
Femur |
Neck |
cyl |
m |
30 (13) |
36 (6) |
32 (4) |
1.9 (5) |
||
|
f |
31 (14) |
29.4 (10) |
23.9 (9) |
1.9 (5) |
|||||
|
Trochanter area |
dс |
m |
43 (26) |
66 (6) |
44 (6) |
30 (7) |
30 (7) |
2.3 (15) |
|
|
f |
34.5 (5) |
58 (7) |
39 (7) |
27 (6) |
27 (6) |
2.3 (15) |
|||
|
Humerus |
Proximal |
dс |
m |
28 (12) |
56 (5) |
56 (5) |
25 (15) |
25 (15) |
1.1 (18) |
|
f |
24.9 (10) |
51.3 (6) |
51.3 (6) |
23.9 (11) |
23.9 (11) |
1.1 (18) |
|||
|
Ribs |
Ribs4 1–2 |
p |
m |
17 (12) |
306 |
7 (14) |
0.7 (38) |
||
|
f |
14 (11) |
306 |
5.5 (15) |
0.7 (38) |
|||||
|
Ribs4 11–12 |
p |
m |
11 (18) |
306 |
6 (17) |
0.7 (38) |
|||
|
f |
9.5 (11) |
306 |
4 (25) |
0.7 (38) |
|||||
|
Ribs4 3, 4, 9, 10 |
p |
m |
13 (8) |
306 |
7 (14) |
0.7 (38) |
|||
|
f |
11.3 (11) |
306 |
6 (14) |
0.7 (38) |
|||||
|
Ribs4 5, 6, 7, 8 |
p |
m |
14 (14) |
306 |
8 (13) |
0.7 (38) |
|||
|
f |
12.5 (11) |
306 |
6.8 (13) |
0.7 (38) |
|||||
|
Sacrum |
Body-1 |
p |
m |
30 (7) |
40 (11) |
24.5 (10) |
1.5 (8) |
||
|
f |
30 (9) |
37.8 (11) |
22.2 (12) |
1.5 (8) |
|||||
|
Body-2-3 |
p |
m |
46 (8) |
28.7 (11) |
15 (9) |
1.5 (8) |
|||
|
f |
45.2 (15) |
28 (11) |
13.8 (13) |
1.5 (8) |
|||||
|
Body-4-5 |
p |
m |
36 (9) |
28 (11) |
8.5 (13) |
1.5 (8) |
|||
|
f |
35 (14) |
28 (11) |
8.5 (12) |
1.5 (8) |
|||||
|
Sacrum |
Pedicle 1 |
сyl |
m+f |
13.9 (14) |
23.7 (15) |
15.3 (11) |
1.5 (8) |
||
|
Pedicle 2 |
сyl |
m+f |
14.2 (14) |
25.0 (11) |
13.6 (17) |
1.5 (8) |
|||
|
Pedicle 3 |
сyl |
m+f |
13.9 (14) |
18.3 (11) |
13.2 (14) |
1.5 (8) |
|||
|
Pedicle 4 |
сyl |
m+f |
13.9 (14) |
14.5 (11) |
11.2 (18) |
1.5 (8) |
|||
|
Ala 1 |
p |
m |
30 (13) |
20 (10) |
42 (13) |
1.5 (8) |
|||
|
f |
30 (9) |
21 (15) |
38.6 (8) |
1.5 (8) |
|||||
|
Ala 2 |
p |
m |
26 (15) |
23 (17) |
25 (8) |
1.5 (8) |
|||
|
f |
26 (9) |
23 (17) |
22.7 (13) |
1.5 (8) |
|||||
|
Ala 3–4 |
pr |
m+f |
19 (16) |
18 (9) |
38.5 (15) |
38.5 (15) |
1.5 (8) |
||
|
Pelvic bones |
Iliac ala |
p |
m+f |
9.5 (31) |
306 |
306 |
1 (30) |
||
|
Iliac crest |
p |
m |
11 (15) |
306 |
13 (9) |
1 (30) |
|||
|
f |
11 (15) |
306 |
13 (9) |
1 (30) |
|||||
|
Iliac dorsal segment7 |
p |
m+f |
19 (16) |
306 |
306 |
1 (30) |
|||
|
Ischium ramus |
сyl |
m+f |
306 |
34 (9) |
25 (8) |
0.5 (30) |
|||
|
Pubis ramus inferior |
dс |
m+f |
47 (17) |
16 (25) |
22 (23) |
26 (23) |
14 (36) |
0.5 (30) |
|
|
Pubis ramus superior (lower part) |
p |
m |
32 (19) |
15 (20) |
29 (20) |
0.7 (30)4 1.5 (12) 4 |
|||
|
f |
19 (13) |
11 (7) |
33 (18) |
0.7 (30) 4 1.5 (12) 4 |
|||||
|
Pubis ramus superior (upper) |
p |
m |
51.2 (8) |
14.5 (20) |
16 (20) |
0.7 (30) 4 1.5 (12) 4 |
|||
|
f |
55.8 (77) |
11 (18) |
13 (20) |
0.7 (30) 4 1.5 (12) 4 |
|||||
|
Acetabulum |
hc |
m+f |
29 (10) |
26 (10) |
21 (20) |
0.5 (30) 5 3.6 (30) 5 |
|||
|
Skull |
Flat bones4 |
p |
m+f |
5.2 (12) |
306 |
306 |
1.3 (33)3 1.5 (22)3 |
||
|
Clavicle |
Shaft (acromial part) |
сyl |
m |
56 (7) |
26 (15) |
24 (12) |
12 (5) |
12 (8) |
0.8 (2) |
|
f |
51.5 (6) |
24 (16) |
21 (14) |
10 (10) |
10 (9) |
0.8 (2) |
|||
|
Ends |
dс |
m |
20 |
26 (15) |
24 (12) |
0.6 (19) |
|||
|
f |
20 |
24 (16) |
21 (14) |
0.6 (19 |
|||||
|
Shaft (sternal part) |
dс |
m |
56 (7) |
22 (14) |
12 (5) |
12 (9) |
12 (8) |
0.8 (2) |
|
|
f |
51.5 (6) |
21 (14) |
12 (10) |
10 (10) |
10 (9) |
0.8 (2) |
|||
|
Scapula |
Glenoid |
сyl |
m+f |
8.8 (18) |
48 (11) |
26 (11) |
0.8 (13) |
||
|
Acromion |
p |
m+f |
20 (9) |
36 (9) |
26 (10) |
0.9 (28) |
|||
|
Lateral margin |
p |
m+f |
306 |
5 (10) |
10 (13) |
0.8 (13) |
|||
|
Sternum |
Body |
p |
m |
1 (10) |
306 |
306 |
1.1 (42) |
||
|
f |
9 (10) |
306 |
306 |
1.1 (42) |
|||||
|
Manubrium |
p |
m |
1.3 (16) |
306 |
306 |
1.45 (22) |
|||
|
f |
1.1 (16) |
306 |
306 |
1.45 (22) |
|||||
|
Cervical vertebrae |
Vertebral body 3–7 |
сyl |
m |
13 (16) |
19 (14) |
16 (12) |
0.3 (7) |
||
|
f |
12 (6) |
16 (6) |
15 (8) |
0.3 (7) |
|||||
|
Vertebral body 2 |
p |
m+f |
19.2 (13) |
14.3 (10) |
17.5 (3) |
0.3 (7) |
|||
|
Lateral mass 1 |
p |
m+f |
15 (13) |
11.4 (9) |
10.5 (9) |
0.3 (7) |
|||
|
Thoracic vertebrae |
Vertebral body |
сyl |
m |
27 (7) |
33 (9) |
28 (11) |
1.3 (16) |
||
|
f |
22 (6) |
29 (6) |
26 (8) |
1.3 (16) |
|||||
|
Lamina+inferior articular. proc. |
p |
m+f |
32 (12) |
10.2 (14) |
4.2 (13) |
1.3 (16) |
|||
|
Spinous process |
p |
m+f |
10.3 (15) |
50 (4) |
5.1 (20) |
1.3 (16) |
|||
|
Superior articular process |
p |
m+f |
11.4 (12) |
11.3 (14) |
4.4 (11) |
1.3 (16) |
|||
|
Transverse process |
p |
m+f |
12 (9) |
18 (11) |
10.6 (13) |
1.3 (16) |
|||
|
Lumbar vertebrae |
Vertebral body |
сyl |
m |
27 (12) |
35 (8) |
47 (9) |
1.3 (34) |
||
|
f |
27 (7) |
32 (8) |
43 (8) |
1.3 (34) |
|||||
|
Lamina+inferior articular. proc. |
p |
m+f |
20.4 (10) |
12.7 (13) |
4.1 (13) |
1.0 (34) |
|||
|
Spinous process |
p |
m |
24 (13) |
31 (6) |
6 (17) |
0.4 (50) |
|||
|
f |
20 (15) |
31 (6) |
6 (17) |
0.4 (50) |
|||||
|
Superior articular process |
p |
m+f |
14 (14) |
15 (13) |
12 (17) |
1.0 (34) |
|||
|
Transverse process |
p |
m+f |
12 (8) |
23 (9) |
8 (13) |
0.4 (50) |
|||
Table prepared by the authors using data from [13][28]
Note: m — male; f — female; m+f — BPS was modeled independent of sex
1 — phantom shape was designated as follows: cyl — cylinder, dc — deformed cylinder, p — rectangular parallelepiped, pr — prism with triangle base; t — hollow cylinder;
2 — BPS dimensions were designated as follows: h — height; a — major axis (c), major axis for a large base (dc) or side а (p) or outer diameter (t); b — minor axis (c), minor axis for a large base (dc) or side b (p) or inner diameter (t); с — major axis for a small base (dc); d — minor axis for a small base (dc); for prism (pr): a, b, c — sides of the triangle base;
3 — cortical layer thickness was assumed to be different for the inner (medial) and outer (gluteal) surfaces of a given segment of the skull;
4 — symphyseal surface covered by thicker cortical layer than other surfaces of BPS;
5 — a higher Ct. Th. value assumed for the medial side of the acetabulum
6 — BPS imitated only a part of the simulated bone segment, when the bone segment dimensions exceeded significantly 30 mm, since in terms of dosimetry in such cases it makes no sense to simulate the entire bone fragment
7 — describing thick part of ilium, adjacent to sacrum
The characteristics of adult human phantoms are comprehensively presented in the literature, including about 260 publications with descriptions of 28,000 people or bone samples [26]. The processes of ossification in the adult human skeleton are complete, as well as the conversion of bone marrow into yellow marrow. Those skeleton areas that are small in size and/or do not ossify in childhood, and being omitted in modeling for this reason, were modeled for adults. This is why the phantom of the adult human skeleton contains a greater number of BPS in its composition than the phantoms of younger age groups [14–17]. The distribution of RBM for adults differs significantly from that for children: the proportion of RBM in the skull is 6.2%, which is twice lower than for 10-year-old children [17]; the largest proportion of RBM in adulthood is typical for the bones of the pelvis and spine. BV/TV for adult BPS is, on average, 1.5-fold lower than for BPS of 10-year-old children. Tb. Th. practically does not change with age, while Tb. Sp. increases, on average, by 15% compared to the age of 10-year-old. Table 6 compares the volumes of media in the BPS for a ten-year-old child with those for adult males and females.
The total volume of adult phantoms is, on average, 17% higher than that of a 10-year-old, with a much more significant increase in skeletal size. Such small volume differences are associated with the cessation of hematopoiesis in skeletal areas modeled by relatively large phantoms, as well as with a more detailed segmentation of the skeleton, resulting in a large number of small BPS. Nevertheless, for BPS, which are modeled in a similar manner for 10-year-olds and adults, a significant increase in the volume of media with age is observed, as shown in Table 6. For such BPS, the media volume showed, on average, a twofold increase. The sex differences in the media volume in the composition of phantoms modeled for adults for individual BPS reached 62% (the upper branch of the sciatic bone), averaging 8%.
For adults, the data on the mass ratio of lumbar vertebrae were reported in [37]. According to this information, the weight of a lumbar vertebra equals 65.3 ± 4% of the mass of the entire vertebra. Due to the small amount of RBM, the vertebral pedicles were not modeled in the framework of the SPSD. Nevertheless, the mass of BPS of the vertebral body comprises 70.0 ± 5% of the sum of the masses of all BPS simulating the lumbar vertebra, which agrees well the published measurements of actual bones.
Table 6. Comparison of BPS volumes of 10-year-old children with adult males and females
|
BPS |
Modeled media |
Volume of modeled structure, cm3 |
||
|
10-year-old |
Adults |
|||
|
Male |
Female |
|||
|
Femur neck |
BM |
6.95 |
18.43 |
10.39 |
|
TB |
3.77 |
3.68 |
2.14 |
|
|
CB |
3.93 |
5.94 |
4.58 |
|
|
Entire BPS |
14.65 |
28.05 |
17.11 |
|
|
Lumbar vertebra body |
BM |
12.42 |
28.55 |
23.73 |
|
TB |
1.97 |
4.96 |
4.19 |
|
|
CB |
0.38 |
1.37 |
1.26 |
|
|
Entire BPS |
14.77 |
34.88 |
29.18 |
|
|
Cervical vertebra body |
BM |
1.43 |
2.29 |
1.64 |
|
TB |
0.38 |
0.6 |
0.46 |
|
|
CB |
0.07 |
0.21 |
0.17 |
|
|
Entire BPS |
1.88 |
3.1 |
2.27 |
|
Table prepared by the authors using data from [17]
In this paper, we present a description of SPSD skeletal phantoms for male and female adults. Each skeleton phantom consists of 46 basic phantom segments, including the proximal parts of the femur and humerus, sacrum, ribs, pelvic bones, skull, clavicles, scapulae, sternum, as well as the vertebrae of the cervical, thoracic, and lumbar regions. At the same time, sex differences in linear sizes were typical for 25 out of 46 segments. The microarchitecture parameters and cortical thickness did not differ between the male and female segment phantoms. On the basis of the estimated variability in the parameters of phantom segments, 12 SPS were generated for each basic bone phantom segment. The DF calculated for SPS will be used to estimate the population variability of DF.
The presented adult phantoms will be used to calculate the 89.90Sr transition coefficients in order to improve dose estimates for residents of the Ural region. This work is the fifth in a series of papers addressing the parameters of computational skeletal phantoms of people of different ages and sexes. In future works, we aim to create SPSD phantoms for male and female 15-year-old children. The generated phantoms can be used for internal dosimetry of osteotropic beta-emitters in the population, as well as for dosimetry of other beta-emitting radionuclides, including those used in radionuclide therapy, such as 89Sr, 32P, 186Re, 188Re, 117mSn.
1. Pafundi D. Image-based skeletal tissues and electron dosimetry models for the ICRP reference pediatric age series. Dissertation for the degree of doctor of the philosophy. University of Florida; 2009.
1. Krestinina LY, Epifanova S, Silkin S, Mikryukova L, Degteva M, Shagina N, et al. Chronic low-dose exposure in the Techa River Cohort: risk of mortality from circulatory diseases. Radiat Environ Biophys. 2013;52(1):47–57. https://doi.org/10.1007/s00411-012-0438-5
2. Akleev AV. Hronicheskiy luchevoy sindrom u zhiteley pribrezhnyh sel reki Techa. Chelyabinsk: Kniga; 2012 (In Russ.). EDN: QMDBZR
3. Preston DL, Sokolnikov ME, Krestinina LY, Stram DO. Estimates of Radiation Effects on Cancer Risks in the Mayak Worker, Techa River and Atomic Bomb Survivor Studies. Radiat Prot Dosimetry. 2017;173(1–3):26–31. https://doi.org/10.1093/rpd/ncw316
4. Degteva MO, Napier BA, Tolstykh EI, Shishkina EA, Shagina NB, Volchkova AY, et. al. Enhancements in the Techa River Dosimetry System: TRDS-2016D Code for Reconstruction of Deterministic Estimates of Dose From Environmental Exposures. Health physics. 2019;117(4):378–87. https://doi.org/10.1097/HP.0000000000001067
5. Spiers FW, Beddoe AH, Whitwell JR. Mean skeletal dose factors for beta-particle emitters in human bone. Part I: volume-seeking radionuclides. The British journal of radiology.1978;51(608):622–7. https://doi.org/10.1259/0007-1285-51-608-622
6. O’Reilly SE, DeWeese LS, Maynard MR, Rajon DA, Wayson MB, Marshall EL, et al. An 13 image-based skeletal dosimetry model for the ICRP reference adult female-internal electron 14 sources. Phys Med Biol. 2016;61(24):8794–824. https://doi.org/10.1088/1361-6560/61/24/8794
7. Xu XG, Chao TC, Bozkurt A. VIP-Man: an image-based whole-body adult male model constructed from color photographs of the Visible Human Project for multi-particle Monte Carlo calculations. Health Phys. 2000;78(5):476–86. https://doi.org/10.1097/00004032-200005000-0000
8. Shah AP, Bolch WE, Rajon DA, Patton PW, Jokisch DW. A paired-image radiation transport model for skeletal dosimetry. J Nucl Med. 2005;46(2):344–53. PMID: 15695796
9. Hough M, Johnson P, Rajon D, Jokisch D, Lee C, Bolch W. An image-based skeletal dosimetry model for the ICRP reference adult male–internal electron sources. Phys Med Biol. 2011;56(8):2309–46. https://doi.org/10.1088/0031-9155/56/8/001
10. Bolch WE, Eckerman, K, Endo A, Hunt JGS, Jokisch DW, Kim CH, et al. ICRP Publication 143: Paediatric Reference Computational Phantoms. Ann ICRP.2020;49(1):5–297. https://doi.org/10.1177/0146645320915031
11. Degteva MO, Tolstykh EI, Shishkina EA, Sharagin PA, Zalyapin VI, Volchkova AY, et al. Stochastic parametric skeletal dosimetry model for humans: General approach and application to active marrow exposure from bone-seeking beta-particle emitters. PLoS ONE.2021;16(10):e0257605. https://doi.org/10.1371/journal.pone.0257605
12. Volchkova AYu, Sharagin PA, Shishkina EA. Internal bone marrow dosimetry: the effect of the exposure due to 90 Sr incorporated in the adjacent bone segments. Bulletin of the South Ural State University. Ser. Mathematical Modelling, Programming & Computer Software.2022;15(4):44–58. https://doi.org/10.14529/mmp220404
13. Shishkina EA, Sharagin PA, Volchkova AYu. Analytical Description of the Dose Formation in Bone Marrow due to 90 Sr Incorporated in Calcified Tissues. Radiation Safety Issues. 2021;3:72–82 (In Russ.). EDN: LYGTKD
14. Sharagin PA, Shishkina EA, Tolstykh EI. Computational red bone marrow dosimetry phantom of a one-year-old child enabling assessment of exposure due to incorporated beta emitters. Extreme Medicine. 2023;3:43–52 https://doi.org/10.47183/mes.2022.045
15. Sharagin PA, Shishkina EA, Tolstykh EI. Computational red bone marrow dosimetry phantom of a one-year-old child enabling assessment of exposure due to incorporated beta emitters. Extreme Medicine. 2023;3:43–52 https://doi.org/10.47183/mes.2023.030
16. Sharagin PA, Tolstykh EI, Shishkina EA. Computational phantom for a 5-year old child red bone marrow dosimetry due to incorporated beta emitters. Extreme Medicine. 2023;4:79–90. https://doi.org/10.47183/mes.2023.061
17. Sharagin PA, Tolstykh EI, Shishkina EA. Computational phantom for the dosimetry of the red bone marrow of a 10-year-old child due to incorporated beta-emitters. Extreme Medicine. 2024;2:35–45. https://doi.org/10.47183/mes.2024.032
18. Campbell BA, Callahan J, Bressel M, Simoens N, Everitt S, Hofman MS, et al. Distribution Atlas of Proliferating Bone Marrow in Non-Small Cell Lung Cancer Patients Measured by FLT-PET/ CT Imaging, With Potential Applicability in Radiation Therapy Planning. Int J Radiat Oncol Biol Phys. 2015;92(5):1035–43. https://doi.org/10.1016/j.ijrobp.2015.04.027
19. Cristy M. Active bone marrow distribution as a function of age in humans. Phys Med Biol. 1981;26(3):389–400. https://doi.org/10.1088/0031-9155/26/3/003
20. Robinson RA. Chemical analysis and electron microscopy of bone. Bone as a tissue. 1960;186–250.
21. Vogler JB. 3rd, Murphy WA. Bone marrow imaging. Radiology. 1988;1683:679–93. https://doi.org/10.1148/radiology.168.3.3043546
22. Vande Berg BC, Malghem J, Lecouvet FE, Maldague B. Magnetic resonance imaging of the normal bone marrow. Skeletal Radiology. 1998;27:471–83. https://doi.org/10.1007/s002560050423
23. Vande Berg BC, Malghem J, Lecouvet FE, Maldague B. Magnetic resonance imaging of normal bone marrow. Eur Radiol. 1998;8(8):1327–34. https://doi.org/10.1007/s003300050547
24. Taccone A, Oddone M, Dell’Acqua AD, Occhi M, Ciccone MA. MRI “road-map” of normal age-related bone marrow. II. Thorax, pelvis and extremities. Pediatr Radiol. 1995;25(8):596–606. https://doi.org/10.1007/bf02011826
25. Taccone A, Oddone M, Occhi M, Dell’Acqua AD, Ciccone MA. MRI «road-map» of normal age-related bone marrow. I. Cranial bone and spine. Pediatr Radiol.1995;25(8):588–95. https://doi.org/10.1007/bf02011825
26. Tolstykh EI, Sharagin PA, Shishkina EA, Volchkova AYu, Smith MA, Napier BA. Stochastic parametric skeletal dosimetry model for human: anatomical-morphological basis and parameter evaluation. PlosOne. 2024. Submitted.
27. Sharagin PA, Shishkina EA, Tolstykh EI, Volchkova AYu, Smith MA, Degteva MO. Segmentation of hematopoietic sites of human skeleton for calculations of dose to active marrow exposed to bone-seeking radionuclides. Conference proceedings of sixth international conference on radiation and applications in various fields of research. Macedonia; 2018. https://doi.org/10.21175/RadProc.2018.33
28. Valentin J. Basic anatomical and physiological data for use in radiological protection: reference values. Annals of the ICRP. 2002;32(3–4):1–277. https://doi.org/10.1016/S0146-6453(03)00002-2
29. Woodard HQ, White DR. The composition of body tissues. Br.J. Ru&oI. 1986;59:1209–18. https://doi.org/10.1259/0007-1285-59-708-1209
30. Shishkina EA, Timofeev YS, Volchkova AY, Sharagin PA, Zalyapin VI, Degteva MO, et al. Trabecula: A Random Generator of Computational Phantoms for Bone Marrow Dosimetry. Health Phys. 2020;118(1):53–9. https://doi.org/10.1097/hp.0000000000001127
31. Parisien MV, McMahon D, Pushparaj N, Dempster DW. Trabecular architecture in iliac crest bone biopsies: infra-individual variability in structural parameters and changes with age. Bone.1988;9(5):289–95. https://doi.org/10.1016/8756-3282(88)90012-9
32. Hazrati Marangalou J, Ito K, Taddei F, van Rietbergen B. Inter-individual variability of bone density and morphology distribution in the proximal femur and T12 vertebra. Bone. 2014;60:213–20. https://doi.org/10.1016/j.bone.2013.12.019
33. Van Dessel J, Huang Y, Depypere M, Rubira-Bullen I, Maes F, Jacobs R. A comparative evaluation of cone beam CT and micro-CT on trabecular bone structures in the human mandible. Dento maxillo facial radiology. 2013;42(8):20130145. https://doi.org/10.1259/dmfr.20130145
34. Fanuscu MI, Chang TL. Three-dimensional morphometric analysis of human cadaver bone: microstructural data from maxilla and mandible. Clinical oral implants research. 2004;15(2):213–8. https://doi.org/10.1111/j.1600-0501.2004.00969.x
35. Ibrahim N, Parsa A, Hassan B, van der Stelt P, Aartman IH, Nambiar P. Influence of object location in different FOVs on trabecular bone microstructure measurements of human mandible: a cone beam CT study. Dento maxillo facial radiology. 2014;43(2):20130329. https://doi.org/10.1259/dmfr.20130329
36. Shishkina EA, Sharagin PA, Tolstykh EI, Smith MA, Napier BA, Degteva MO. Uncertainty of stochastic parametric approach to bone marrow dosimetry of 89,90 Sr. Heliyon. 2024;10(4):e26275. https://doi.org/10.1016/j.heliyon.2024.e26275
37. Wang Y, Videman T, Boyd SK, Battié MC. The distribution of bone mass in the lumbar vertebrae: are we measuring the right target? The spine journal: official journal of the North American Spine Society. 2015;15(11):2412–6. https://doi.org/10.1016/j.spinee.2015.06.059
Pavel A. Sharagin
Chelyabinsk
Evgenia I. Tolstykh, Dr. Sci. (Biol.)
Chelyabinsk
Elena A. Shishkina, Dr. Sci. (Biol.)
Chelyabinsk
Sharagin P.A., Tolstykh E.I., Shishkina E.A. Computational phantom for red bone marrow dosimetry in adult males and females. Extreme Medicine. 2025;27(2):220-228. https://doi.org/10.47183/mes.2025-286
10 bld. 1 Pogodinskaya Str., Moscow, Russia 119121
tel.: +7 (495) 540-61-71, ext.: 4190, 4191, 4192
E-mail: Extrememedicine@cspfmba.ru
Processing of personal data