


Contents
Scroll to:
https://doi.org/10.47183/mes.2025-322
Scroll to:
Introduction. In Russia, locomotor training is the key approach to mitigating the negative effects of weightlessness. Locomotor training is performed according to strictly defined protocols, without individualization and periodization of the training process.
Objective. To study the effect of periodization of locomotor training on the performance of crewmembers during long-term space missions.
Materials and methods. The study involved 12 cosmonauts, who were divided into two groups. The first group (BD, n = 6) included the participants who performed locomotor training in strict accordance with the standard on-board documentation system. The second group (ID, n = 6) included the participants who performed training using individual protocols and periodization of the training process. The assessment of physical performance was carried out according to the results of a regular stepwise locomotive test prior to a spaceflight (SF) mission and three times during SF. The test evaluated the achieved speeds at the most intensive stages of testing, the distance traveled during the test, and heart beats per distance (pulse value performance). Statistical processing was carried out in Statistica 10; nonparametric methods of descriptive statistics were used.
Results. In the second part of SF, cosmonauts in the ID group reached higher speeds at the stages of medium and fast running and covered a greater distance by 18.5–20.7% (p < 0.05) and 5–12% (p < 0.05) compared with the BD group and with the baseline testing, respectively. The beats per distance in the ID group was lower throughout the SF compared to both the baseline values and the BD group in the 2nd and 3rd flight testing sessions.
Conclusions. In the conditions of SF, locomotor training programs based on periodization and individualization demonstrate a greater preventive effectiveness compared to standard on-board training.
Lysova N.Yu., Savenko O.A., Kotov O.V. New approaches to the organization of locomotor training during long-term spaceflight. Extreme Medicine. 2025;27(2):197-204. https://doi.org/10.47183/mes.2025-322
One of the main medical support systems for long-term spaceflights is that for mitigating the negative effects of weightlessness. Such a system is designed to maintain the physical performance of members of long-term space expeditions and to alleviate the symptoms of the microgravity adaptation syndrome through a range of measures to reduce negative effects or promote the restoration of altered functions [1].
In long-term SF, physical training aimed at maintaining the physical performance and basic physical qualities of crewmembers is of particular importance. In the Russian prevention system, physical training is conventionally divided into three stages:
(1) the adaptation to microgravity stage lasts approximately 30 days; at this initial stage, physical training is performed at 50% of the recommended load, followed by its gradual increase to the recommended level;
(2) the stabilization stage, lasting 110–130 days depending on the duration of the flight, assumes physical training according to the standard scheme; the load at this stage does not change significantly;
(3) the final stage, starting 30 days before boarding, assumes physical training with increased locomotor load; in addition, training with negative pressure on the lower body is applied [1][2].
It should be noted that SF conditions, onboard of the ISS in particular, limit the performance of physical training to the equipment available on board. These include a treadmill as the main means, a bicycle ergometer, a power loader, an Advanced Resistive Exercise Device (ARED) strength simulator of the American segment of the ISS, and resistance bands. In our study, only locomotor training modes will be considered, taking into account the periodization of physical activity.
Periodization is the cyclical ordering of training workouts in accordance with the principles of volume and intensity specificity in order to achieve maximal performance during the most important stages of physical training. In relation to a space station, the stages of a manned expedition that place the greatest demands on the physical performance of a cosmonaut are extravehicular activities and return to Earth. Periodization of physical training is essential to managing physical performance by reducing the risk of fatigue and the decrease of fitness. Periodization includes long-term (macro- and mesocycles) and short-term (microcycles) planning of physical training [3]. Cyclical changes in the volume, intensity, and types of exercises in training cycles avoids the effect of overtraining, while contributing to achieving peak levels of physical performance at the appropriate stages of SF [4].
Currently, locomotor training is carried out according to on-board documentation using the BD-2 treadmill equipment in four-day microcycles. Each day of this microcycle is aimed at maintaining a certain physical quality, i.e., day 1 — speed, day 2 — strength, day 3 –endurance, and day 4 — active recovery. On day 4, cosmonauts either do not exercise at all or perform low-intensity workouts at their discretion [5][6]. Longer periodization in meso- and macrocycles is rarely carried out, as a result of which this approach contradicts modern ideas about the organization of the training process [7].
In this article, we set out to investigate the effect of periodization of locomotor training on the performance of crewmembers during long-term space missions.
The study involved 12 cosmonauts participating in long-term space expeditions (average age 42 ± 5 years). The participants were divided into two groups, depending on the selected approach to performing locomotor training during SF:
In the individual protocols of the ID group, an interval training method was used. The intensity of the intervals used was 70–80% of the maximum heart rate (HR) recorded in the MO-3 test (medical examination 3) [1] during preflight testing. In the ID group, the spaceflight itself was a macrocycle, conditionally divided into 5–6 mesocycles lasting 4–5 weeks, depending on the tasks and duration of the flight. In this group, a pyramidal approach to periodization was used, assuming a reduction in the volume and an increase in the intensity of the load [8, 9, 10]. In addition, in the ID group, in the middle of SF (2–3 mesocycles), a planned decrease in the intensity of physical activity and unloading microcycles were used during the transition to a new mesocycle.
Physical performance was assessed on the basis of the standard MO-3 medical test. This test was performed in the passive mode of operation of the treadmill (i.e., the treadmill was moved by the force of the cosmonaut’s legs). The test had a strict time structure: 3 min of walking, 2 min of slow running, 2 min of medium running, 1 minute of fast running, and 3 min of walking; the speeds in this test were selected by the crewmembers subjectively according to their state of health.
Locomotor training, as well as MO-3 testing, were performed on a BD-2 treadmill (Institute of Biomedical Problems of the RAS, Russia). Prior to SF, testing was performed on a full analog of the BD-2 treadmill, but without a vibration isolation system and a training loading suit. Heart rate was recorded using a Polar heart rate monitor (Polar Electro Oy, Finland).
The research comprised the following stages:
The test results were analyzed by the groups described above in terms of the parameters described below.
The distance traveled in the test was analyzed, as well as the maximum speeds of locomotion at the most intense stages: moderate and fast running. The moderate running stage (the 3rd pre-maximum load stage in the MO-3 test) was performed at a speed that cosmonauts defined personally as of medium intensity. In our study, the average speed of locomotion at this stage was 8 km/h. The fast-running stage (the 4th stage in the MO-3 test) was performed with maximum intensity; in our study, the average speed of locomotion at this stage was 9.5 km/h.
The number of heart beats per the distance traveled (pulse value performance1) was used as an integral indicator of performance. This indicator was calculated as the ratio of the total heart rate per test to the distance traveled.
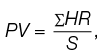 (1)
(1)
PV — beats per distance traveled (hereinafter pulse value performance);
∑HR — heart rate during the test (beats per min);
S — distance traveled during the test (m).
It should be noted that the magnitude of axial load during SF testing was significantly lower than that on Earth (60–70% of body weight). However, this parameter was not integrated into the pulse value formula, since its effect on the heart rate response is apparently nonlinear. Given the absence of statistically significant differences between the groups according to this parameter (Fig. 1), the groups are to be compared with each other.
In addition, we calculated the pulse debt as the difference between the sum of heart beats during a 5-min recovery period and the resting heart rate before the onset of testing.
Statistical processing was carried out in the Statistica10 software; nonparametric methods of descriptive statistics were used. When comparing indicators within the group, the Wilcoxon t-test with the Benjamini-Yekutieli procedure was used [11]; when comparing between the groups, the Mann–Whitney U-test was used. The median Me, interquartile range, and percentage of changes relative to the baseline were calculated. For a more complete description of the research cohort, outliers and extreme values are additionally presented. The former are the values that are highly different from those in the cohort; extremes are the border values in the cohort.
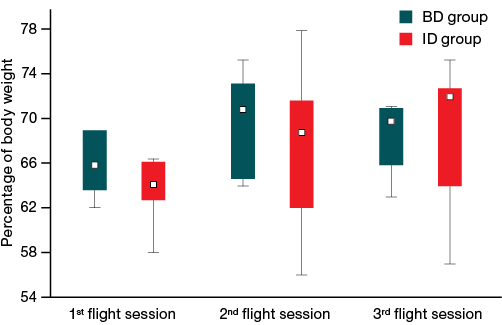
Figure prepared by the authors using their own data
Fig. 1. Axial load in groups when performing the MO-3 test
In order to determine the volume and intensity of the load in the BD and ID groups, we considered the average distances traveled during each workout and the distances traveled in the passive mode of operation of the treadmill. The number of training sessions for the cosmonauts of both groups was almost identical; thus, the average distance traveled per training session may indicate the amount of work performed.
Throughout SF, we did not detect any differences between the groups in terms of the average distance traveled during training (Fig. 2).
The average distance traveled during training in the ID group was 3326 m in the first month of SP, having increased by 6.6% (to 3547 m) by the second month of SP. During the third month of SP, this indicator decreased by 5.8%, i.e., to 3341 m, compared to the second month of SP. During the fourth month of SP, in order to achieve the undulation of the training load, the distance traveled increased by 4.3% compared to the previous month, which corresponded to 3484 m. During the fifth month of SP, this indicator decreased by 7% to 3241 m, being significantly different from that in the fourth month (p < 0.05). In the sixth month of SF, the average distance traveled in training was 3261 m, being also significantly different from that in the fourth month (p < 0.05) (Fig. 2).
In the BD group, in the first month of SF, the average distance per workout was 3018 m. In the second month of SF, this indicator increased by 5.1% and amounted to 3172 m. Further (in the third, fourth, and fifth months of SF), the changes in distance traveled were less than 1%. During the sixth month of SF, this indicator decreased by 3.8% compared to the fifth month and amounted to 3055 m.
In order to assess the intensity of the load, the distance traveled in the passive mode of operation of the treadmill was used. This mode is more stressful than the active mode, since its implementation requires an additional force of 3.5 kgf [12]. Overall, the total training time remained unchanged, and the distance traveled in the passive mode of operation of the treadmill depended on the speed and time of execution of this mode. Taking into account the above, we believe that a change in the distance traveled in the passive mode of operation of the treadmill during a workout may indicate a change in the intensity of the load. Data on the average distance traveled in the active mode of operation of the treadmill were not considered, since this mode is less stressful and less indicative in terms of intensity.
There were no significant differences between the groups in terms of the average distance traveled in the passive mode throughout SF (Fig. 3).
In the ID group, from the first to the third month of SF, an increase in the distance traveled in the passive mode was observed (Fig. 3). During months 1, 2, and 3 of SF, this indicator was 787, 955, and 1024 m, respectively. During the fourth month of SF, in accordance with the periodization of the training process, the distance traveled in the passive mode was reduced to 1004 m. In the fifth month of SF, this indicator increased by 15.9% compared to the fourth month to 1167 m; this indicator was also significantly higher than that in all previous months of SP (p < 0.05). During the sixth month of SF, the distance traveled in the passive mode of operation of the treadmill increased by 17.7% relative to the fifth month and amounted to 1369 m. This indicator was also significantly higher (p < 0.05) than that in all previous months of the flight cycle (Fig. 3).
In the BD group, this indicator did not undergo such significant changes throughout the SF. During months 1, 2, 3, 4, 5, and 6, this value was 1297, 1367 (+5.5%), 1418 (+3.7%), 1413 (–0.3%), 1494 (+5.7%), and 1497 m (+0.2%), respectively.
The distance traveled before SF in the MO-3 test between the groups did not differ and amounted to 1144.5 m in the ID group and 1095 m in the BD group (Fig. 4).
In the first flight session, the ID group experienced a 6.9% increase in the distance traveled (1202.5 m) compared to the baseline. In the BD group, the distance traveled decreased by 7.3% (1040 m) compared to the preflight survey, while no significant differences were recorded between the groups. In the second flight session, the ID group experienced a further increase in the distance traveled (1234.5 m), which was significantly higher than in the baseline test (p < 0.05). In the BD group, the distance traveled practically did not change, while this indicator was significantly lower than in the ID group (p < 0.05) and amounted to 1022 m. In the third flight session, there was an increase in the distance traveled in both groups: 1281 m in the ID group, being significantly higher compared to both the baseline values and the BD group (p < 0.05). In the BD group, this indicator was 1126 m, which effectively corresponded to the preflight value (Figure 4).
The speed of locomotion at the fast-running stage before SF in the ID and BD groups was 9.65 and 9.2 km/h, respectively. However, no significant differences were recorded between the groups (Fig. 5). In the first flight session, the ID group experienced an increase in this indicator by 5.2% (10.15 km/h) compared to the baseline, while the BD group showed a decrease in speed by 4.9% (8.7 km/h) compared to the baseline test.
In the second flight session, the ID group experienced a further increase in speed at the fast-running stage to 10.45 km/h (p < 0.05), which was 8.3% higher relative to the baseline value. In the BD group, this indicator was 8.9 km/h, while a significant difference in this indicator was recorded between the groups (p < 0.05). In the third flight session, the locomotion speed at the fast-running stage in the ID group was 10.35 km/h, being significantly higher than in the BD group, where this indicator was 8.95 km/h.
No significant differences between the groups were recorded at the stage of moderate-intensity running during the preflight testing (Fig. 6). At the same time, in the ID group, the speed of locomotion was increasing from session to session and comprised 8.2 km/h in the baseline testing, 8.45 km/h in the first flight session, 8.63 km/h in the second flight session, 8.78 km/h in the third flight session. Significant changes compared to the baseline (p < 0.05) were noted in the second and third flight sessions.
In the BD group, the moderate-running speed of locomotion throughout SF was reduced relative to the baseline by 4.7–8.7%, namely 7.55 km/h in the first flight session, 7.15 km/h in the second flight session, 7.55 km/h in the third flight session against the baseline values of 7.93 km/h. In addition, in the third flight session, the speed in the BD group was significantly lower compared to the ID group (Fig. 6).
The indicator of beats per distance (pulse value performance) in the preflight testing did not differ significantly between the groups. In the ID and BD groups, this indicator before SF was 1.48 and 1.54 beats/min/m, respectively (Fig. 7).
During SF, the ID group showed a significant decrease in the pulse value parameter in all flight sessions, compared to the baseline. Thus, its values were 1.35 beats/min/m (–8.8%) in the first flight session, 1.28 beats/min/m (–13.2%) in the second flight session, and 1.31 beats/min/m (–11.3%) in the third flight session. In the BD group, this indicator tended to decrease, although never reaching the level of significance in any flight sessions and comprised 1.44 beats/min/m in the first flight session (–6.7%), 1.48 beats/min/m in the second flight session (–4.2%), and 1.43 beats/min/m in the third flight session (–7.1%). In addition, in the second and third flight sessions, the beats per distance parameter in the ID group was significantly lower compared to the BD group (Fig. 7).
In terms of pulse debt, we found no statistically significant differences between or within the groups.
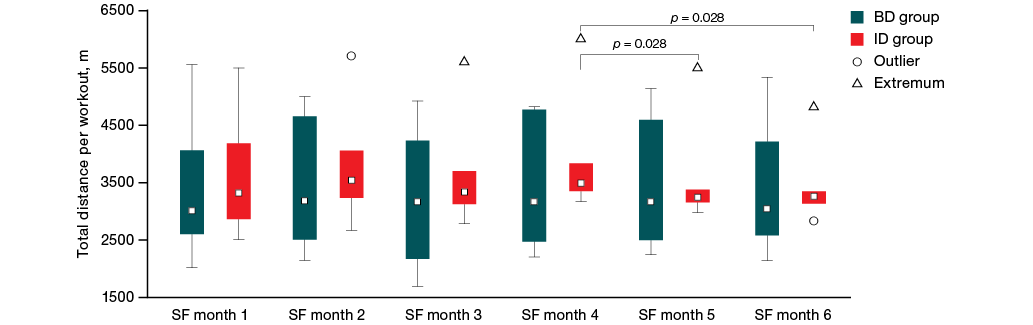
Figure prepared by the authors using their own data
Fig. 2. Total distance per workout
Note: data presented as the median (Me) of the values of the lower and upper quartiles Q [ 25–75%]; p — statistical significance level.
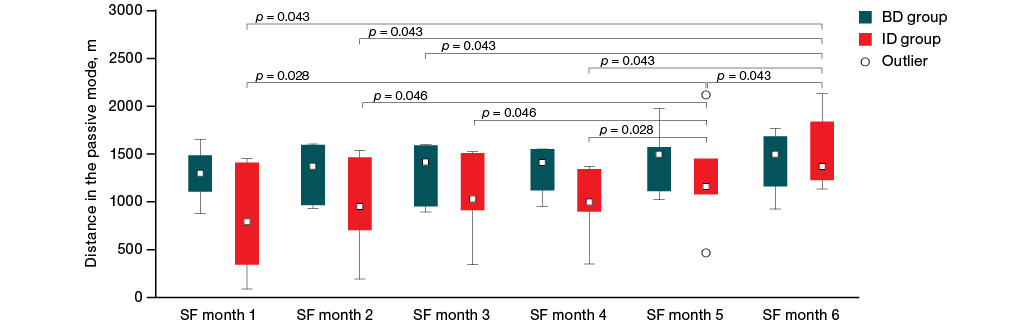
Figure prepared by the authors using their own data
Fig. 3. Distance traveled in the passive mode of operation of the treadmill
Notе: data presented as the median (Me) of the values of the lower and upper quartiles Q [ 25%–75%]; p — statistical significance level.
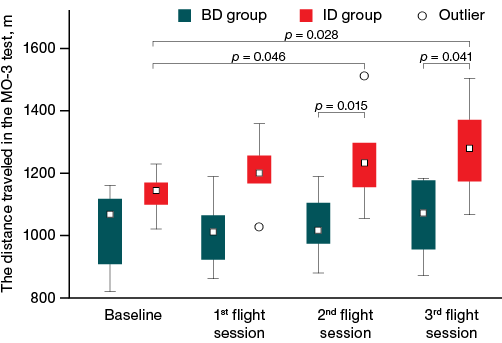
Figure prepared by the authors using their own data
Fig. 4. The distance traveled in the MO-3 test
Notе: data presented as the median (Me) of the values of the lower and upper quartiles Q [ 25–75%]; p — statistical significance level.
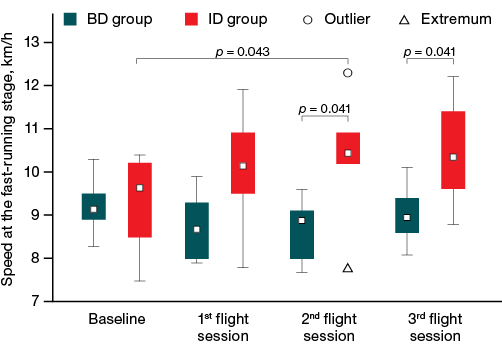
Figure prepared by the authors using their own data
Fig. 5. Locomotion speed at the fast-running stage in the MO-3 test
Note: Data presented as the median (Me) of the values of the lower and upper quartiles of Q [ 25–75%]; p — statistical significance level.
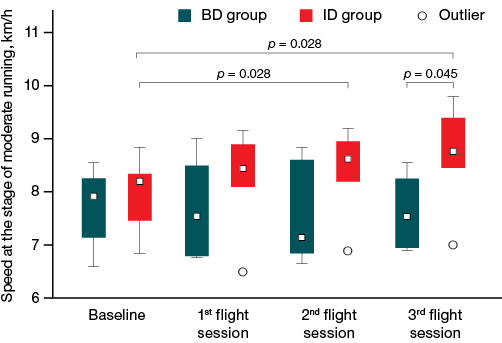
Figure prepared by the authors using their own data
Fig. 6. Locomotion speed at the stage of moderate running in the MO-3 test
Note: data presented as the median (Me) of the values of the lower and upper quartiles Q [ 25–75%]; p — statistical significance level.
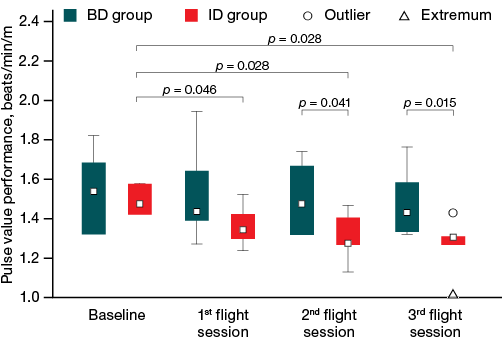
Figure prepared by the authors using their own data
Fig. 7. Beats per distance (pulse value performance) in the MO-3 test
Note: data presented as the median (Me) of the values of the lower and upper quartiles Q [ 25–75%]; p — statistical significance level.
Prolonged exposure to SF conditions leads to a decrease in the level of physical performance [13]. Physical training can mitigate the negative effects of SF factors, which makes both the equipment and organization of the training process, including its periodization, highly important. Experts of the Russian prevention system proposed the use of periodization of physical activity under conditions of prolonged SF, based on the principle of undulation [14]. In addition, the developers of this system noted the need for an individual approach, taking into account the selective attitude of crewmembers to the recommended means and methods of physical training [14]. It should be noted that our study considered only treadmill training; however, the use of other preventive measures also had an effect on the level of physical performance of crewmembers. At the same time, the results of training achieved using a bicycle ergometer and a strength simulator was similar in both groups. These workouts were performed every other day, while treadmill training was performed daily and, accordingly, had a greater effect on the physical performance of the crewmembers.
In our study, the BD group showed a decrease in the studied indicators (distance traveled, speed of locomotion at the stages of fast and moderate running) in the first flight session, despite the reduced axial load, thus indicating a decrease in physical performance. Subsequently, during the flight, these indicators demonstrated a slight increase, except for the speed at the moderate-intensity running stage, which indicated some recovery in performance. In the ID group, the distance traveled and the speed of locomotion increased in the first flight session compared to the baseline. The results obtained in the BD group are consistent with those reported by other researchers on a decreased performance of crewmembers during early flight stages, which gradually normalized at later stages. This observation was explained the implementation of preventive measures [15].
The MO-3 test can be represented as an analog of the Cooper test [16], where performance is assessed by the distance traveled. The step-by-step structure of this test makes it possible to identify the most significant stages in testing, i.e., moderate and fast running, indicating the maximum achievable power in testing. Testing in the passive mode requires an additional 3.5 kgf of effort from crewmembers to maintain the speed of the BD-2 treadmill [12], which is significantly complicated in SF conditions due to developing muscular atony and atrophy [17]. It should be noted that during SF, the use of the passive mode is also complicated by the specific features of the biomechanics of movement on the treadmill, which is operated by a vibration isolation system, as well as by the use of a training loading suit. Prior to SF, when performing testing, cosmonauts place their hands on special handrails located in front of them at the shoulder level, thereby facilitating pushing the treadmill belt back. In SF conditions, the use of these handrails is impossible due to the presence of a passive vibration isolation system. The additional hand support from the front shifts the center of mass of the treadmill belt forward, moving beyond the center of mass of the vibration isolation system. This significantly increases the pitch and leads to a downward tilt of the front of the belt, while the back of the belt rises and rests against the frame. In order to avoid this effect, cosmonauts use a training loading suit as a support, which requires additional body tilt to create a force pushing the belt back, while the step length is significantly reduced.
The observed changes in the beats per distance parameter (pulse value) during SF in our study are consistent with the results obtained by Moore et al. [15]. A gradual decrease in this indicator during SF indicated an increase in physical performance, with the changes being more pronounced in the ID group. The noted decrease in physical performance during the first month of SF may be due to various factors [18], including a decrease in plasma volume [19], a decrease in left ventricular mass [20][21], and muscular atrophy [22][23]. Significantly lower pulse value indicators in the ID group, starting from the second flight session, may indicate the efficiency of periodization of the training process in maintaining muscle strength and performance in SF conditions.
In other space agencies, the periodization of physical training is carried out in limited volumes. At the National Aeronautics and Space Administration (NASA), treadmill training involves a gradual increase in axial load from 60% to 80%; training protocols are created individually for each crewmember, or the astronaut performs training at his discretion. The ARED strength simulator uses a training periodization that includes two three-month macrocycles. Each macrocycle consists of four mesocycles of three weekly microcycles. The microcycle consists of six workouts performed with heavy (4 sets, 6 repetitions), light (4 sets, 12 repetitions), and medium (4 sets, 8 repetitions) loads sequentially, using three training protocols. In the mesocycle, workouts vary such that each protocol uses a hard, light, and medium day. In each microcycle, there is a gradual increase in the weight of the load by 5% from the repeated maximum. In the second three-month macrocycle, the weight of the load increases based on the values obtained in the last weeks of the first macrocycle [24].
In the European Space Agency, the entire flight period is conditionally divided into three stages, similar to the Russian prevention system. These include the initial (the first 20 days of SF), the main (about 130–150 days), and the final (15–30 days before landing) stages. At the initial stage of the flight, the load on the treadmill and bicycle ergometer is low and gradually increases at the discretion of the crew. On a strength simulator, the load is 50–60% of the repeated maximum. At the main stage, the load is increased gradually on all the tools used. At the final stage, the load is maintained at a high level, while the proportion of workouts performed on a strength simulator and a treadmill increases, and the number of workouts on a bicycle ergometer decreases [25].
Thus, in all the considered systems of prevention of the negative effects of weightlessness, the periodization of the training process is not implemented at its fullest. The main approach is to gradually increase the load (speed, axial load, weight of the load); however, none of the considered systems takes into account differences between the adaptation phases, as well as the time difference between recovery and adaptation during the training process.
In our study, the use of locomotive training, taking into account the principles of periodization and individualization, allowed the crewmembers to perform testing with a greater power and a greater amount of work than the training recommended by on-board documentation.
The indicator of heart beats per distance (pulse value) in the group of cosmonauts performing individual training was lower, despite the greater volume of load and the developed power.
Thus, the use of the principles of periodization and individualization in the conditions of SF has a greater preventive effectiveness compared to standard on-board training.
1. Translator’s note: In the Russian system, the indicator of heart beats per distance is referred to as “pulse value performance”. These terms are used interchangeably throughout the text.
1. Grigorev AI, Ditlayn LF, Kozlovskaya IB, Souin ChF. Countermeasures in short-term and long-term space flights.. In: Pestov ID, Ditlayn LF, ed. Space biology and medicine. Health Performance safety of space crews. Saint-Peterburg: Nauka; 2001. P. 63–98 (In Russ.).
2. Paladugu P, Ong J, Kumar R, Waisberg E, Zaman N, Kamran SA, Lee AG. Lower body negative pressure as a research tool and countermeasure for the physiological effects of spaceflight: a comprehensive review. Life Sciences in Space Research. 2024;42:8–16. https://doi.org/10.1016/j.lssr.2024.03.007
3. Plisk SS, Stone MH. Periodization strategies. Strength & Conditioning Journal. 2003;25(6):19–37. https://doi.org/10.1519/00126548-200312000-00005
4. Haff GG. Roundtable discussion: Periodization of training. Part 1. Strength & Conditioning Journal. 2004;26(1):50–69. https://doi.org/10.1519/00126548-200402000-00016
5. Kozlovskaya IB, Pestov ID, Egorov AD The countermeasure system in long-duration space flights. Aerospace and environmental medicine. 2008;42(6):66–73 (In Russ.). EDN: QBAVLZ
6. Fomina EV, Lysova NYu, Kozlovskaya IB. Countermeasure of the negative effects of weightlessness. In: Grigor’ev AI. Ushakov IB, ed. Space medicine and biology. Collection of scientific articles. Moscow: IMBP, 2013. P. 61–79 (In Russ.).
7. Bompa TO, Buzzichelli C. Periodization-: theory and methodology of training. 5th ed. USA: Human kinetics; 2019.
8. Issurin VB. New horizons for the methodology and physiology of training periodization. Sports medicine. 2010;40:189–206. https://doi.org/10.2165/11319770-000000000-00000
9. Casado A, González-Mohíno F, González-Ravé JM, Foster C. Training periodization, methods, intensity distribution, and volume in highly trained and elite distance runners: a systematic review. International journal of sports physiology and performance. 2022;17(6):820–33. https://doi.org/10.1123/ijspp.2021-0435
10. Seiler S. What is best practice for training intensity and duration distribution in endurance athletes?. International journal of sports physiology and performance. 2010;5(3):276–91. https://doi.org/10.1123/ijspp.5.3.276
11. Benjamini Y, Yekutieli D. The control of the false discovery rate in multiple testing under dependency. Annals of statistics. 2001;1165–88. https://doi.org/10.1214/aos/1013699998
12. Yarmanova EN, Kozlovskaya IB. Approaches to the development of the treadmill simulator for manned space stations. Moscow: Petit; 2020 (In Russ.).
13. Hackney KJ, Scott JM, Hanson AM, English KL, Downs ME, Ploutz-Snyder LL. The astronaut-athlete: optimizing human performance in space. The Journal of Strength & Conditioning Research. 2015;29(12):3531–45. https://doi.org/10.1519/JSC.0000000000001191
14. Grigorev AI, Stepantsov VI, Tishler AV, Mikhaylov VM, Pometov YuD, Dorokhova BR. Means and methods of countermeasure of the adverse effects of weightlessness. In: Gurovskiy NN, ed. The results of medical research performed at the orbital research complex “Salyut-6” — “Soyuz”. Moscow, 1986. P. 125–45 (In Russ.).
15. Moore AD, Lynn PA, Feiveson AH. The first 10 years of aerobic exercise responses to long-duration ISS flights. Aerospace Medicine and Human Performance. 2015;86(12):A78–86. https://doi.org/10.3357/AMHP.EC10.2015
16. Apte S, Troxler S, BessonC, Gremeaux V, Aminian, K. Augmented Cooper test: Biomechanical contributions to endurance performance. Frontiers in Sports and Active Living. 2022;4:935272. https://doi.org/10.3389/fspor.2022.935272
17. Vinogradova OL, Tomilovskaya ES, Kozlovskaya IB. The gravitational factor as the basis of the evolutionary adaptation of animal organisms to activity in Earth conditions. Aerospace and environmental medicine. 2020;54(6):5–26 (In Russ.). https://doi.org/10.21687/0233-528X-2020-54-6-5-26
18. Pramanik J, Kumar A, Panchal L, Prajapati B. Countermeasures for Maintaining Cardiovascular Health in Space Missions. Current Cardiology Reviews. 2023;19(5):57–67. https://doi.org/10.2174/1573403X19666230330083225
19. Alfrey CP, Udden MM, Leach-Huntoon C, Driscoll T, Pickett MH. Control of red blood cell mass in spaceflight. Journal of applied physiology. 1996;81(1):98–104. https://doi.org/10.1152/jappl.1996.81.1.98
20. Perhonen MA, Franco F, Lane LD, Buckey JC, Blomqvist CG, Zerwekh JE, et al. Cardiac atrophy after bed rest and spaceflight. Journal of applied physiology. 2001;91(2):645–53. https://doi.org/10.1152/jappl.2001.91.2.645
21. Shibata S, Wakeham DJ, Thomas JD, Abdullah SM, Platts S, Bungo MW, Levine BD. Cardiac effects of long-duration space flight. Journal of the American College of Cardiology. 2023;82(8):674–84. https://doi.org/10.1016/j.jacc.2023.05.058
22. Fitts RH, Colloton PA, Trappe SW, Costill DL, Bain JL, Riley DA. Effects of prolonged space flight on human skeletal muscle enzyme and substrate profiles. Journal of applied physiology. 2013;115(5):667–79. https://doi.org/10.1152/japplphysiol.00489.2013
23. Satcher RL, Fiedler B, Ghali A, Dirschl DR. Effect of Spaceflight and Microgravity on the Musculoskeletal System: A Review. JAAOS-Journal of the American Academy of Orthopaedic Surgeons. 2024;32(12):535–41. https://doi.org/10.5435/JAAOS-D-23-00954
24. Loehr JA, Guilliams ME, Petersen N, Hirsch N, Kawashima S, Ohshima H. Physical training for long-duration spaceflight. Aerospace medicine and human performance. 2015;86(12):A14–23. https://doi.org/10.3357/AMHP.EC03.2015
25. Petersen N, Jaekel P, Rosenberger A, Weber T, Scott J, Castrucci F, et al. Exercise in space: the European Space Agency approach to in-flight exercise countermeasures for long-duration missions on ISS. Extreme physiology & medicine. 2016;5:1–13. https://doi.org/10.1186/s13728-016-0050-4
Nataliya Yu. Lysova, Cand. Sci. (Biol.)
Moscow
Olga A. Savenko
Moscow
Oleg V. Kotov, Cand. Sci. (Med.)
Moscow
Lysova N.Yu., Savenko O.A., Kotov O.V. New approaches to the organization of locomotor training during long-term spaceflight. Extreme Medicine. 2025;27(2):197-204. https://doi.org/10.47183/mes.2025-322
10 bld. 1 Pogodinskaya Str., Moscow, Russia 119121
tel.: +7 (495) 540-61-71, ext.: 4190, 4191, 4192
E-mail: Extrememedicine@cspfmba.ru
Processing of personal data