


Contents
Scroll to:
 E. A. Malik,
Y. A. Nashchekina,
I. A. Barsuk,
K. P. Golovko,
V. N. Alexandrov,
V. Y. Elokhovskiy,
V. E. Yudin
E. A. Malik,
Y. A. Nashchekina,
I. A. Barsuk,
K. P. Golovko,
V. N. Alexandrov,
V. Y. Elokhovskiy,
V. E. Yudin https://doi.org/10.47183/mes.2025-272
Scroll to:
Introduction. Carriers intended for cell culture and transplantation are widely used in modern tissue engineering. The creation of inks for printing such media assumes a wide range of variations in their shape and architecture. Chitosan as a natural polymer is increasingly finding application in various fields of regenerative medicine. Chitosan-based scaffolds are an artificial prototype of the extracellular matrix in vitro. The method of 3D printing can be used to bring the structure of such a matrix as close as possible to the properties of native tissues. However, in order to achieve the desired printing quality, the task of developing a chitosan-based ink composition and selecting optimal printing parameters should be solved.
Objective. Development of a biocompatible chitosan-based ink with optimal rheological properties suitable for 3D printing.
Materials and methods. A bioink was manufactured using the chitosan produced by BiologHeppe (Germany) with a molecular weight of 164 kDa and a deacetylation degree of 92.5%. Starch produced by Merck (Germany) was used to modify the bioink. The method of 3D extrusion bioprinting was used to obtain 3D matrices by a 3D bioprinter by Rockit Invivo (Republic of Korea) equipped with the Android OS software. 3D-printed matrices were obtained from a bioink with different chitosan concentrations: 4% and 6%. Cultures of rabbit mesenchymal stem cells were seeded to study the biocompatibility of the printed structures.
Results. The developed chitosan- and starch-based inks demonstrated an increased viscosity of the solution and improved characteristics of the printed designs. The rheological parameters were optimized for printing by increasing the chitosan concentration in the solution up to 6%, as well as by introducing starch at a similar concentration into the solution. An in vitro study also showed the biocompatibility of the printed structures with respect to mesenchymal stromal cells.
Malik E.A., Nashchekina Y.A., Barsuk I.A., Golovko K.P., Alexandrov V.N., Elokhovskiy V.Y., Yudin V.E. Biocompatible chitosan- and starch-based gels for 3D printable inks. Extreme Medicine. 2025;27(1):88-96. https://doi.org/10.47183/mes.2025-272
Additive technologies, including 3D printing, are driving major innovations in diverse fields of science, including medicine and biology.
Various polymers of natural and synthetic origin are used as printing materials. Such structures can serve as a basis for manufacturing functional 3D fabrics [1]. These biomaterials are referred to as inks that mimic the composition of human or animal body tissues. The advantage of 3D printing consists in the possibility of reproducing the geometry of a 3D structure that is more similar to a natural biological system than an in vitro 2D model. The structural similarity of the printed design can lead to more physiologically relevant functional results. No other technology is capable of providing such a level of geometric complexity and similarity to living tissues [2].
3D printing allows 3D volumetric media to be created for use as 3D cell cultures for further transplantation into damaged organs and tissues [2]. The printed designs, together with the cells grown thereon, may serve as tissue models for testing new drugs [3].
The printing parameters can be defined as bioprinter settings (firmware input) that are necessary for an accurate creation of 3D-printed structures. In this sense, only a certain range of values is suitable for 3D printing, with their choice being a key factor in obtaining viable structures. These values depend on the ink composition, which should be carefully selected in each specific case [4].
The main printing parameters include dispenser temperature, substrate temperature, printing speed, and input flow parameters (speed and pressure). Being directly related to the overall 3D printing time, the printing speed (movement across the XY plane) is a highly important parameter. In addition, in the extrusion printing method, the hydrogel flow (thread width) is managed primarily by the printing speed and the retraction speed. The printing speed values used vary from 0.2 to 150 mm/s, ranging within1–30 mm/s in the majority of cases [4].
The exact dimensions of a 3D-printed structure can be preserved when the input flow is selected correctly, which is indicated as a percentage. This parameter is responsible for the amount of ink being extruded by the printer. Input flow calibration also improves the retraction settings [4].
The main properties of 3D printable inks include strand printability, viscoelastic properties, biodegradability, and cytocompatibility [5]. The 3D matrix should mimic the biological environment and facilitate cell attachment, proliferation, and growth; promote the dispersion of bioactive molecules and growth factors; and contain space for the extracellular matrix [6].
Although both natural and synthetic polymers can be used as inks, the preference is given to natural materials due to their high biocompatibility. At the same time, natural materials may exhibit insufficient mechanical properties [7]. The most commonly used components in ink are chitosan and alginate, followed by gelatin, hyaluronic acid, silk fibroin, and polyethylene glycol [8]. Hydrogels can mimic, e.g., the modulus of elasticity of soft tissues of the human body. For the most durable tissues, such as bones or teeth, other materials are required — thermoplastic polymers with the addition of hydrogels [8].
Chitosan is one of the most promising materials for 3D printing. Chitosan has three types of reactive functional groups: amino groups, as well as primary and secondary hydroxyl groups at C-2, C-3, and C-6 positions, respectively. The positive charge of its functional groups makes chitosan the only positively charged natural polysaccharide. Consequently, chitosan is able to interact with negatively charged biomolecules, lipids, proteins, deoxyribonucleic acid (DNA), and various cellular receptors that trigger a cascade of interrelated reactions in living organisms, which determines its unique characteristics [9]. Among such characteristics of chitosan-based bioink are good cell–matrix interactions, imitation of the structure of native tissues, creation of a microenvironment for oxygen and nutrient exchange, as well as a favorable immune response after implantation.
According to Huang J. et al., 3D-printed structures showed biomolecular adaptation, stable biocompatibility, and biological activity even after various post-printing modifications [10]. However, chitosan is not devoid of disadvantages, such as a slow gelation rate, sufficient thermal stability, and a low mechanical strength of materials produced on its basis.
It is important to note that the physical stability and mechanical strength of 3D printable inks depend on their viscoelastic properties. The viscoelastic properties of chitosan can be achieved through physical or chemical crosslinking methods, as well as by introducing additional components. Therefore, chitosan is often structurally reinforced with other biopolymers, including polysaccharides. Starch can be used as such a reinforcing biopolymer [11]. Starch consists of carbohydrates, possessing the properties of hydrophilicity, biocompatibility, low cost, good biodegradability, and non-toxicity [12]. Starch consists of a granular form with linear amylose and a large amount of branched amylopectin. The starch structure is semi-crystalline; thus, the addition of a limited amount of water under the action of heat and shear treatment will lead to the destruction of hydrogen bonds. At this stage, the starch will melt, resulting in the formation of a thermoplastic starch. Thus, we assume that the combination of biocompatible and biodegradable biopolymers, such as chitosan and starch, may compensate for the disadvantages of each biopolymer individually and that their combined use will make it possible to obtain inks with optimal characteristics for the formation of carriers with specified structural characteristics by 3D printing. In order to obtain a predictable result, namely matrices with specified structural characteristics, such as the size and height of cells, the optimal ratio of chitosan and starch, as well as optimal printing parameters, should be determined.
In this research, we aimed to develop biocompatible inks with an optimal ratio of chitosan and starch, suitable for 3D printing.
Chitosan (BiologHeppe, Germany) with a molecular weight of 164 kDa and a deacetylation degree of 92.5% and starch (9005-25-8, HC, Merck, Germany) were used to produce ink compositions.
Mesenchymal stem cells (MSCs) obtained from rabbit adipose tissue according to the method [13][14] and provided by the Center for Cellular Technologies of the Institute of Cytology of the Russian Academy of Sciences were used. Adipose tissue was washed in a phosphate-salt buffer followed by treatment with collagenase. Following collagenase inactivation, the cells were centrifuged. The cells were cultured in a α-MEM (modified Igla medium) nutrient medium with the addition of L-glutamine, 10% bovine fetal serum and antibiotics (100 units/mL) — penicillin, 100 micrograms/mL streptomycin (all Gibco reagents, USA). Cells of 4–9 passages were used in the work.
The following procedure was used to obtain a matrix based on pure chitosan and chitosan with the addition of starch. Chitosan was mixed with water at room temperature for 15 min on a laboratory mixer (OSC-10L, Russia) at a mixing speed of 1000 rpm to obtain a suspension, which was further supplemented with acetic acid (at a concentration of 97%, 2% of the solution volume), as well as starch at concentrations from 0 to 6%.
The composition was mixed during 1.5 h on a laboratory mixer (OSC-10L, Russia) at a speed of 1000 rpm until chitosan was completely dissolved. Solutions with starch addition were additionally mixed for 15 min at a temperature of 100°C in a water bath to swell the starch. The volume of chitosan, starch, and acetic acid was calculated in mass percentages. The concentration of chitosan and starch in the solution varied. The compositions of the as-obtained solutions are shown in Table 1. The names of the solutions are presented in the C/S (4/0) format, where C is chitosan and S is starch; in parentheses, — chitosan concentration/starch concentration.
Table 1. Chitosan and starch calculated concentrations in solutions
|
Solutions |
Chitosan concentration, % |
Starch concentration, % |
|
C/S (4/0) |
4 |
0 |
|
C/S (6/0) |
6 |
0 |
|
C/S (4/4) |
4 |
4 |
|
C/S (6/6) |
6 |
6 |
Table prepared by the authors using their own data
The dependence of the shear viscosity of hydrogels on the strain rate was measured on an AntonPaar rheometer (Physica MCR-301 model, Austria) in a cone/plane measuring unit CP25; [ d=1 mm] in shear and dynamic modes, in modes of falling and rising strain rates (circular frequency). A viscosity relaxation test was performed at two shear rates of 100 and 0.01 s–1.
The method of 3D bioprinting extrusion was used to obtain 3D matrices. We used a 3D bioprinter produced by Rokit Invivo (Republic of Korea) equipped with the Android OS software.
To design a 3D matrix, the Autodesk Fusion 360 software application was used, in which a parallelepiped with sides of 16 mm, 10 mm, and 0.2 mm was created.
To set the 3D printer settings and convert the created model into G-code, we used the NewCreator K.
The printing speed (mm/s) is the linear speed of the printing table. The input flow (%) is the pressure exerted on the gel in the syringe. The selected print options are shown in Table 2.
Table 2. Printing parameters for solutions
|
Solutions |
Printing speed, mm/s |
Input flow, % |
|
C/S (4/0) |
1–5 |
25–75 |
|
C/S (6/0) |
1–5 |
75–125 |
|
C/S (4/4) |
3–7 |
125–175 |
|
C/S (6/6) |
3–7 |
125–175 |
Table prepared by the authors using their own data
As a result of 3D bioprinting, volumetric matrices were obtained. Next, they were precipitated in a 10% sodium hydroxide solution for 5 min, after which they were washed with distilled water to remove alkali residues. Subsequently, 96% ethanol was used for additional sterilization, followed by its rinsing with distilled water.
The main parameter describing the print quality in this study is strand printability (SP), which is calculated using formula (1):
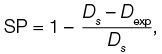
where Dexp is the experimental diameter of the printed strips (mm); Ds is the theoretically found standard diameter (mm).
The experimental diameter of the printed fiber was measured in the ImageJ software. Then the strand printability was calculated using formula (1). The print result was considered satisfactory at SP = 1 ± 0.1 [12]. The diameter of the printhead nozzle equal to 0.9 mm was taken as the standard diameter Ds.
Dexp measurement was performed 30 times for each sample on different sections of the matrix using the ImageJ software. The diameter values were obtained by comparing the measured value with the reference value.
To study the biocompatibility of the printed structures, rabbit mesenchymal stem cell cultures were seeded onto all printed matrices. To that end, 300 µL of cell suspension with a concentration of 5×10⁵ µL–1 was added to each Petri dish followed by incubation at 37°C for 40 min. After that, 8 mL of ready-made nutrient medium containing α-MEM nutrient medium (modified Igla medium) with the addition of L-glutamine, 10% bovine fetal serum and antibiotics (100 units/mL) penicillin, 100 µg/mL streptomycin (all reagents — Gibco, USA) was added to each sample.
The cells were cultured under aseptic conditions at a constant temperature of 37°C, 5% CO2 concentration, and 98% humidity. To analyze the interaction of cells with the matrices, photographs were taken 1 h, 1 day, 3 days, and 7 days after the onset of the study. All experiments were carried out in 3–5 replicates. Lifetime visualization of cells was performed using a Nikon camera (USA); the size scale was 200 µm.
Statistical analysis was performed using the Microsoft Excel software; the Student’s t-test was used to evaluate statistically significant differences between specific samples. The differences were considered statistically significant at p < 0.05.
The data on the dynamic viscosity of ink compositions with different concentrations of chitosan and starch demonstrate an increase in the viscosity of the polymer solution with an increase in concentrations of chitosan and starch in the solution, which appear quite logical (Fig. 1). Under the transition from a higher shear rate (100 s–1), which simulates the movement of the polymer solution in the nozzle of the extruder, to a lower shear rate (0.01 s–1), which simulates the state of the solution on the table of the printing device, the composition of C/S(6/6) shows the highest ability to restore and preserve the shape of the resulting product.
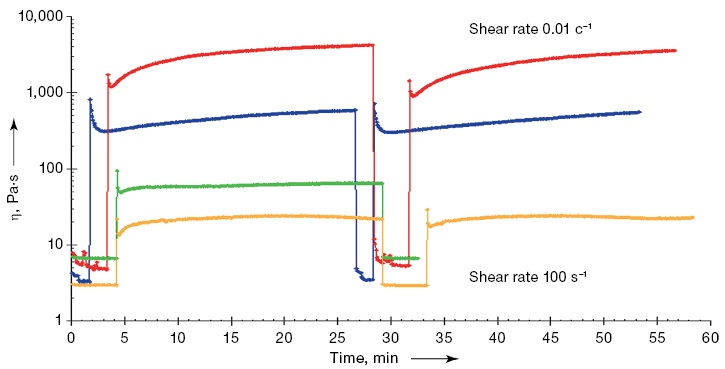
Figure prepared by the authors using their own data
Fig. 1. Dynamic viscosity of hydrogels with different starch–chitosan ratios (X-axis (Time t) — time, min; Y-axis (η) — shear viscosity, Pa·s)
Note: the yellow color of the line is the concentration of 4% chitosan in the solution; the green color of the line is the concentration of 4% chitosan and 4% starch in the solution in a ratio of 1:1; the blue color of the line is the concentration of 6% chitosan in the solution; the red color of the line is the concentration of 6% chitosan and 6% starch in the solution in a ratio of 1:1.
In the first part of the experiment, the printing speed was varied under a constant input flow. In the second part, the amount of input flow was varied at a constant printing speed.
Figures 2–5 show histograms that were used to visually evaluate the ratio of the standard diameter, i.e., the nozzle diameter (0.9 mm, light columns) to the experimental diameter (bright columns). Histograms with blue columns 2A — with a changing speed, with purple 2B — with a changing input flow. The columns are labeled with the values of the average experimental diameter, taking the error into account. Above the histograms are photos of the studied samples. They were taken from the same height next to the millimeter paper, which makes it possible to estimate the actual dimensions of the matrix and calculate the experimental diameters.
The results obtained show that the most approximate values of the experimental diameter to the standard diameter for a solution with a chitosan concentration of 4% and a starch concentration of 4% (C/S– 4/4) were obtained when the printing speed was set to 3 mm/m, and the input flow was 50%. The relevant data is shown in Fig. 2.
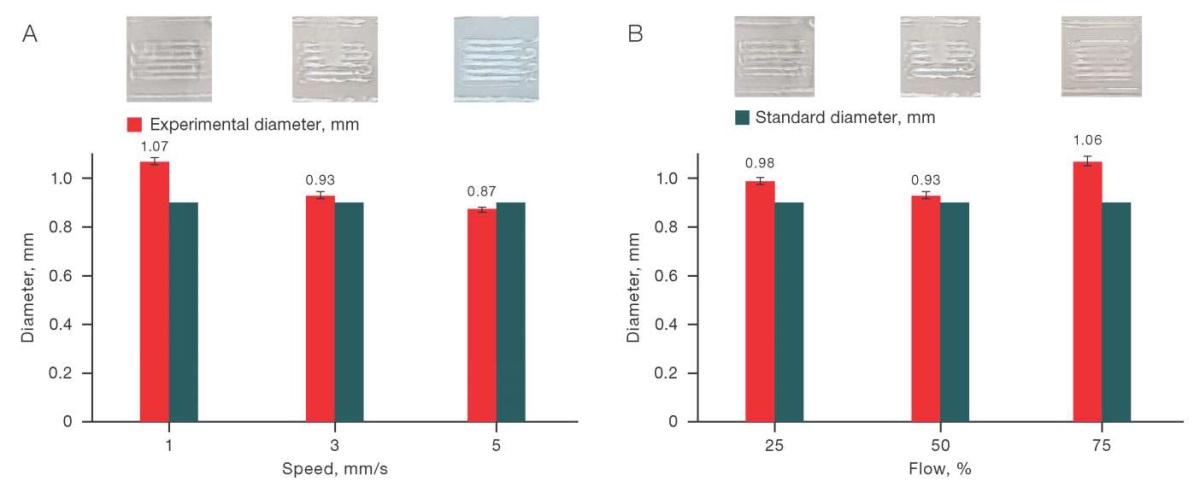
Figure prepared by the authors using their own data
Fig. 2. Effect of printing speed (A) and flow (B) on the printing quality for the C/S solution (4/0)
For the C/S (6/0) solution, the exact value of the experimental diameter was achieved only when the printing speed was set to 3–5 mm/s and the input flow was 100%. Similar to the previous case, this range can be considered quite narrow. The corresponding data is shown in Fig. 3.
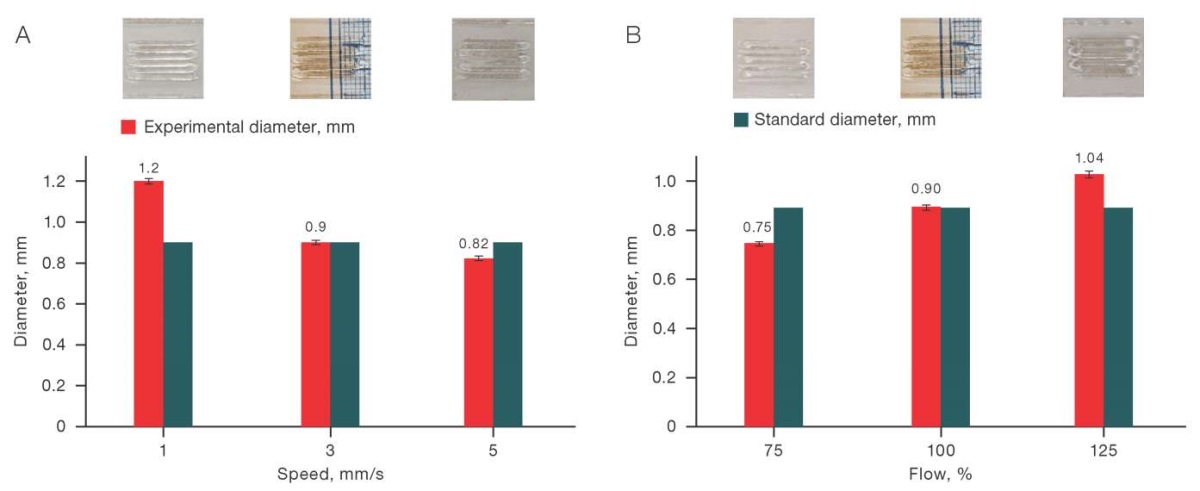
Figure prepared by the authors using their own data
Fig. 3. Effect of printing speed (A) and input flow (B) on the printing quality for the C/S solution (6/0)
For the C/S (4/4) solution, a wide range of settings was obtained, at which the experimental diameter was quite close to the standard diameter: 3–5 mm/s at 150% of the input flow and 5 mm/s at 175% of the input flow. The corresponding data is shown in Fig. 4.
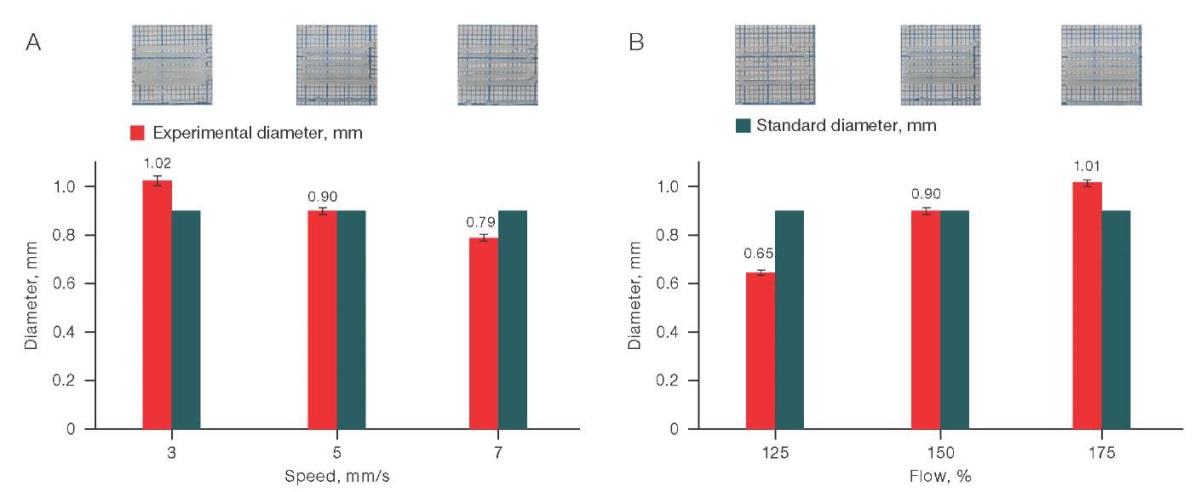
Figure prepared by the authors using their own data
Fig. 4. Effect of printing speed (A) and input flow (B) on the printing quality for the C/S solution (4/4)
The value of the experimental diameter in the C/S sample (6/6) turned out to be the most stable (Fig. 5) when changing the printing parameters. Thus, a sufficiently accurate printing (the proximity of the actual dimensions to the theoretical ones) can be achieved by setting the print speed from 3 to 7 mm/s under an input flow of 125 to 150%.
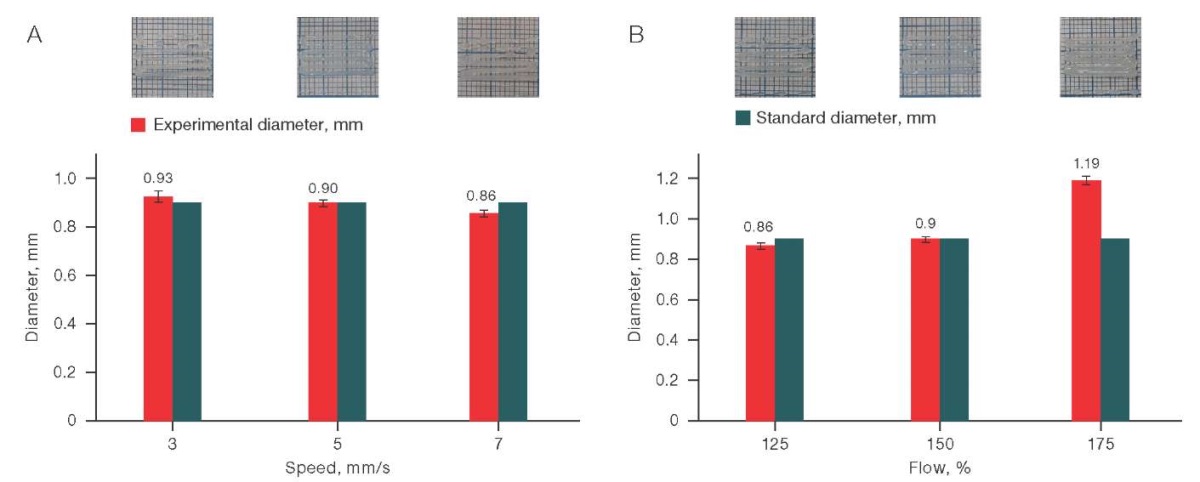
Figure prepared by the authors using their own data
Fig. 5. Effect of printing speed (A) and input flow (B) on the printing quality for the C/S solution (6/6)
Table 3 shows the results of calculations of strand printability of all the studied ink compositions.
Table 3. Effect of printing speed and input flow on strand printability for C/S solutions
|
Solutions |
Flow rate, mm/s |
Input flow, % |
Strand printability |
|
C/S (4/0) |
1 |
50 |
1.19 ± 0.12 |
|
3 |
50 |
1.03 ± 0.13 |
|
|
5 |
50 |
0.97 ± 0.10* |
|
|
3 |
25 |
1.09 ± 0.13♦ |
|
|
3 |
75 |
1.18 ± 0.14 |
|
|
C/S (6/0) |
1 |
100 |
1.34 ± 0.12 |
|
3 |
75 |
0.84 ± 0.10 |
|
|
3 |
125 |
1.15 ± 0.12 |
|
|
5 |
100 |
0.92 ± 0.10 |
|
|
3 |
100 |
1.00 ± 0.10 |
|
|
C/S (4/4) |
5 |
175 |
1.13 ± 0.14 |
|
7 |
150 |
0.88 ± 0.12 |
|
|
3 |
150 |
1.14 ± 0.15 |
|
|
5 |
150 |
1.00 ± 0.12 |
|
|
5 |
125 |
0.72 ± 0.10 |
|
|
C/S (6/6) |
3 |
150 |
1.03 ± 0.16 |
|
5 |
125 |
0.96 ± 0.13 |
|
|
5 |
150 |
1.00 ± 0.13 |
|
|
7 |
150 |
0.95 ± 0.12 |
|
|
5 |
175 |
1.32 ± 0.16■ |
Table prepared by the authors using their own data
Note: * — p < 0.01; ♦ — p < 0.001; ■ — p < 0.0001.
Values close to 1 ± 0.1 were considered acceptable. In all groups, a decrease in printability to 0.9 was observed with an increase in printing speed or a decrease in input flow. In extreme cases, a violation of the integrity of the printed structure was noted. When the printing speed decreases and the input flow increases, the experimental diameter exceeds acceptable values, i.e., the printability value exceeds 1.1. In some cases, strip fusion occurs, which makes it impossible to determine the experimental diameter and printability.
The result can be considered satisfactory when the printing speed is increased to 5 mm/s (p < 0.01) with the same value of the input flow. Consequently, a fairly narrow range of settings was observed, at which the experimental diameter is close to the standard diameter.
When setting the value of the input flow to less than the average (25% (p < 0.001)), an excess of the experimental diameter over the standard value was recorded, which does not correspond to the results of all other groups. This deviation can be explained by an uneven distribution of bioink over the area of the printed structure due to its poor adhesion to glass.
With an increase in the input flow to 175% (p < 0.0001), the experimental diameter exceeds the permissible values (the printed lines are thicker than required).
Thus, the following general conclusion can be drawn. An increase in printing speed and a decrease in input flow leads to a decrease in the thickness of the printed line. The opposite trend was noted under a decrease in printing speed and an increase in input flow.
Printability increases with a simultaneous increase in printing speed and input flow for solutions with a higher viscosity (Fig. 1), such as C/S (4/4) and C/S (6/6). In addition, these solutions are characterized by a wide range of parameters, at which the printability is close to unity. This means that the actual dimensions of the matrices are quite close to the theoretical ones. The use of solutions with a lower density, i.e., C/S (4/0) and C/S (6/0), as bioink requires a more careful selection of printing settings. For such solutions, it was possible to select only one value of the input flow, at which the printability was close to unity.
MSCs were cultured both on the surface of the matrices and next to the printed filaments during the period of seven days.
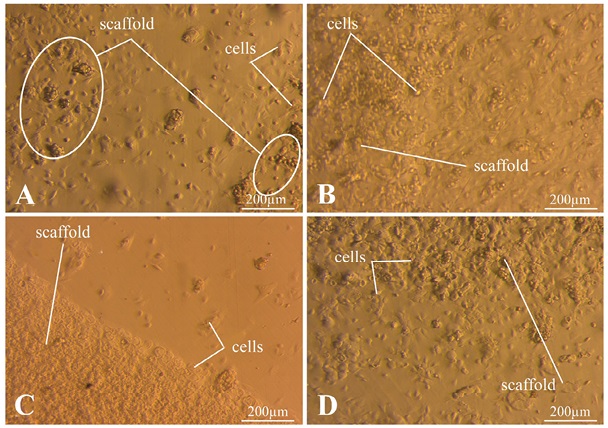
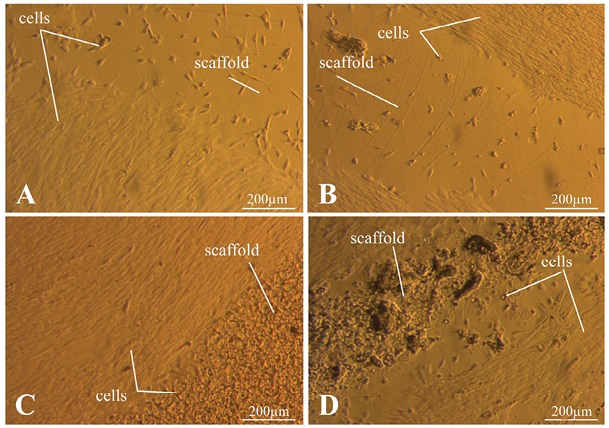
Figure 6 shows an MSC culture 1 h after seeding. MSCs form aggregates near the C/S (4/0) matrix and on its surface (Fig. 6A). Figure 6B demonstrates that the cells are evenly distributed over the surface of the dish, with a small cluster present on the surface of the matrix. The largest number of cells was observed on the C/S matrix (4/4) (Fig. 6), while the cells were concentrated and did not aggregate. In Fig. 6G, an uneven distribution of cells was observed with their high concentration on the surface of the matrix C/S (6/6).
Photos taken by the authors
Fig. 6. Results of MSC culture 1 h after seeding
Note: A — C/S matrix (4/0); B — C/S matrix (6/0); C — C/S matrix (4/4); D — C/S matrix (6/6).
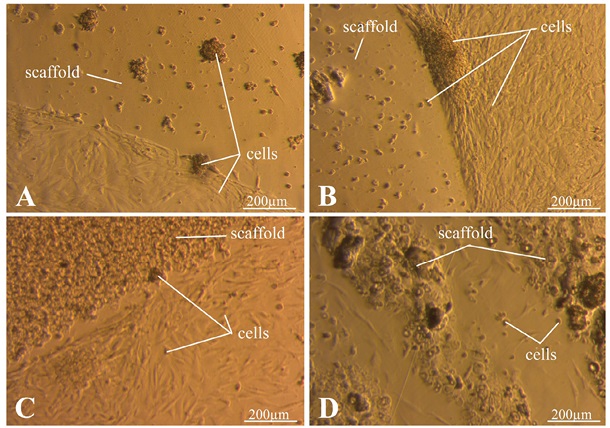
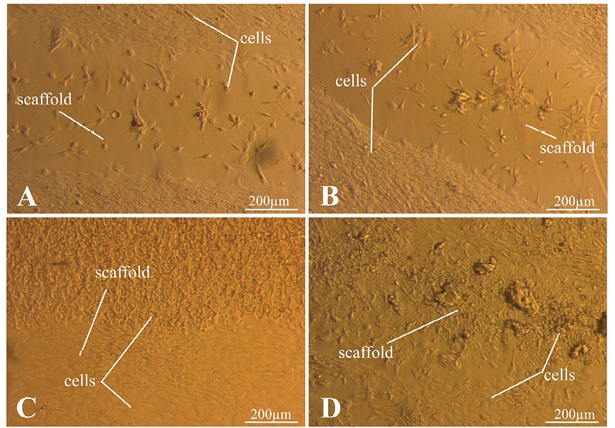
Figure 7 shows photos taken one day after seeding. In Fig. 7A, the cells are spread out on the surface of the dish. Conversely, on the surface of the C/S (4/0) matrix, the cells formed large, loose aggregates. In the case of using the C/S (6/0) matrix (Fig. 7B), a high concentration of cells near the surface was noted. Similar to the previous case, there are significantly fewer cells on the matrix itself. In Fig. 7C, a large number of non-spread cells are observed on the surface of the C/S matrix (4/4). On a Petri dish, the cells are spread out at some distance from the matrix. The C/S matrix (6/6) has a highly heterogeneous structure, as can be seen in Fig. 7D, which makes it difficult to estimate the number of cells. The cell concentration between the printed strips is low.
Photos taken by the authors
Fig. 7. Results of MSC culture one day after seeding
Note: A — C/S matrix (4/0); B — C/S matrix (6/0); C — C/S matrix (4/4); D — C/S matrix (6/6).
Figure 8 shows photos taken three days after seeding. In Figs. 8A and 8D, the spread of cells on the Petri dish surface is observed. On the surface of the C/S (4/0) and C/S (6/0) matrices (Figs. 8A and 8B), the cells are seen in low concentrations without spreading out. In Fig. 8C, cells are observed on the surface of the C/S (4/4) matrix in a high concentration. Figure 8D shows that the cells are spread out at a distance from the surface of the matrix C/S (6/0).
The photos were taken by the authors
Fig. 8. Results of MSC culture three days after seeding
Note: A — C/S matrix (4/0); B — C/S matrix (6/0); C — C/S matrix (4/4); D — C/S matrix (6/6).
Figure 9 shows the results of MSC culture seven days after seeding. Figure 9 (A–C) indicates that the cells are spread out over the Petri dish surface, being adhered tightly to the side surface of the samples. Thus, an assumption can be made about the biocompatibility of the matrices. On the other hand, in Fig. 9D, the cells adhere at a certain distance from the matrix C/S (6/6), which makes this matrix the least preferred for use. The cells do not spread out over the surface of any of the matrices, with their largest number observed on the C/S matrix (4/4). This may indicate a positive effect of starch addition.
Photos taken by the authors
Fig. 9. Results of MSC culture seven days after seeding
Note: A — C/S matrix (4/0); B — C/S matrix (6/0); C — C/S matrix (4/4); D — C/S matrix (6/6).
Our research has shown the possibility of developing effective chitosan- and starch-based inks for 3D bioprinting. An increase in the chitosan concentration in the solution up to 6% along with starch addition was shown to increase the dynamic viscosity of the ink, promoting rapid restoration and prolonged preservation of the polymer solution shape after its flowing out of the extruder nozzle. The conducted experiments allowed us to establish optimal printing parameters, including the printing speed and input flow rate, which made it possible to create polymer matrices with tailored structural characteristics. Preliminary in vitro experiments demonstrated the biocompatibility of the obtained structures with respect to human mesenchymal stromal cells, which shows the prospects of using such polymer compositions in the development of wound coatings for treating damaged skin.
1. Borah A, Kumar DS. Overcoming the barriers of two-dimensional cell culture systems with three-dimensional cell culture systems: Techniques, drug discovery, and biomedical applications. Biomedical Product and Materials Evaluation. 2022;7:179–229. https://doi.org/10.1016/B978-0-12-823966-7.00003-7
2. Pai RR, Sekar JA, Ajit S, Velayudhan S, Kasoju N, Kumar A. Three-dimensional bioprinting of tissues and organs. Biomedical Product and Materials Evaluation. 2022;5:135–50. https://doi.org/10.1016/B978-0-12-823966-7.00018-9
3. Chircov C, Grumezescu AM. Three-dimensional bioprinting in drug delivery. Materials for Biomedical Engineering. 2019;2:19–40. https://doi.org/10.1016/B978-0-12-816913-1.00002-7
4. Mancha Sánchez E, Gómez-Blanco JC, López Nieto E, et al. Hydrogels for Bioprinting: A Systematic Review of Hydrogels Synthesis, Bioprinting Parameters, and Bioprinted Structures Behavior. Frontiers in Bioengineering and Biotechnology. 2020;8:776. https://doi.org/10.3389/fbioe.2020.00776
5. Mukherjee P, Rani A, Saravanan P. Polymeric Materials for 3D Bioprinting. 3D Printing Technology in Nanomedicine. 2019;4:63–81. https://doi.org/10.1016/B978-0-12-815890-6.00004-9
6. Iordache F. Bioprinted Scaffolds. Materials for Biomedical Engine-ering: Hydrogels and Polymer-based Scaffolds. 2019;2:35–60. https://doi.org/10.1016/B978-0-12-816901-8.00002-X
7. Goel A, Meher MK, Gulati K, Poluri KM. Fabrication of Biopolymer-Based Organs and Tissues Using 3D Bioprinting. 3D Printing Technology in Nanomedicine. 2019;3:43–62. https://doi.org/10.1016/B978-0-12-815890-6.00003-7
8. Islam MM, Shahruzzaman M, Biswas S, Nurus Sakib M, Rashid TU. Chitosan based bioactive materials in tissue engineering applications-A review. Bioactive Materials. 2020;5(1):164–83. https://doi.org/10.1016/j.bioactmat.2020.01.012
9. Rajabi M, McConnell M, Cabral J, Ali MA. Chitosan hydrogels in 3D printing for biomedical applications. Carbohydrate Polymers. 2021;260:117768. https://doi.org/10.1016/j.carbpol.2021.117768
10. Huang J, Fu H, Wang Z, Meng Q, Liu S, Wang H et al. BMSCs-laden gelatin/sodium alginate/carboxymethyl chitosan hydrogel for 3D bioprinting. RSC Advances. 2016;6(110):108423–30. https://doi.org/10.1039/C6RA24231F
11. Butler HM, Naseri E, MacDonald DS., Tasker AR, Ali Ahmadi A. Optimization of starch- and chitosan-based bio-inks for 3D bioprinting of scaffolds for neural cell growth. Materialia. 2020;(12):100737. https://doi.org/10.1016/j.mtla.2020.100737
12. Ghosh S, Gutierrez V, Fernández C, Rodriguez-Perez M, Viana JC, Reis RL, Mano JF. Dynamic mechanical behavior of starch-based scaffolds in dry and physiologically simulated conditions: effect of porosity and pore size. Acta Biomaterialia. 2008;4(4):950–9. https://doi.org/10.1016/j.actbio.2008.02.001
13. Krawczenko A, Klimczak A. Adipose Tissue-Derived Mesenchymal Stem/Stromal Cells and Their Contribution to Angiogenic Processes in Tissue Regeneration. International Journal of Molecular Sciences. 2022:23(5):2425. https://doi.org/10.3390/ijms23052425
14. Naghieh S, Sarker M, Sharma NK, Barhoumi Z, Chen X. Printability of 3D Printed Hydrogel Scaffolds: Influence of Hydrogel Composition and Printing Parameters. Applied Sciences. 2020;10(1):292. https://doi.org/10.3390/app10010292
Elena A. Malik
St. Petersburg
Yuliya A. Nashchekina
St. Petersburg
Ilya A. Barsuk
Moscow; St. Petersburg
Konstantin P. Golovko
St. Petersburg
Viktor N. Alexandrov
St. Petersburg
Vladimir Y. Elokhovskiy
St. Petersburg
Vladimir E. Yudin
St. Petersburg
Malik E.A., Nashchekina Y.A., Barsuk I.A., Golovko K.P., Alexandrov V.N., Elokhovskiy V.Y., Yudin V.E. Biocompatible chitosan- and starch-based gels for 3D printable inks. Extreme Medicine. 2025;27(1):88-96. https://doi.org/10.47183/mes.2025-272
10 bld. 1 Pogodinskaya Str., Moscow, Russia 119121
tel.: +7 (495) 540-61-71, ext.: 4190, 4191, 4192
E-mail: Extrememedicine@cspfmba.ru
Processing of personal data