


Contents
Scroll to:
 V. S. Yudin,
E. D. Spektor,
A. A. Mamchur,
M. V. Ivanov,
S. I. Mitrofanov,
L. P. Kuzmina,
I. V. Bukhtiyarov,
A. A. Keskinov,
S. M. Yudin,
D. A. Kashtanova
V. S. Yudin,
E. D. Spektor,
A. A. Mamchur,
M. V. Ivanov,
S. I. Mitrofanov,
L. P. Kuzmina,
I. V. Bukhtiyarov,
A. A. Keskinov,
S. M. Yudin,
D. A. Kashtanova https://doi.org/10.47183/mes.2025-371
Scroll to:
Introduction. Determination of the CYP2C9, CYP2C19, and CYP2D6 genotypes enables therapy personalization for a wide range of medications. The currently available diagnostic panels and international guidelines governing the scope of testing are based on global data concerning the allelic polymorphism of these genes.
Objective. To determine the distribution of allelic variants of the CYP2C9, CYP2C19, and CYP2D6 genes in the population of the Russian Federation, taking regional characteristics into account.
Materials and methods. The study was conducted on a sample from the Genetic Database (GDB) of the Centre for Strategic Planning and Management of Biomedical Health Risks (n = 121,442, covering 85 Russian federal subjects). Whole-genome DNA sequencing was performed for all participants, with CYP2C9, CYP2C19, and CYP2D6 genotyping determined using the PAnno software. In regions with a sufficient number of observations, variant frequencies and the proportions of different metabolic phenotypes were compared, identifying high-risk regions and those with an allelic structure differing from the overall population.
Results. The prevalence of impaired metabolism for CYP2C9 substrates in the population is estimated at 33.66%, for CYP2C19 at 25.37%, and for CYP2D6 at 8.29%. The prevalence of accelerated metabolism for CYP2C19 substrates is 37.37%. The following regions are identified as high-risk for the presence of impaired metabolism of substrates for at least one of the studied isoenzymes: the Republics of Chechnya, Dagestan, Ingushetia, Kabardino-Balkaria, North Ossetia, Chuvashia, Mari El, Udmurtia, Tatarstan, Tyva, Sakha (Yakutia), Kalmykia, Buryatia, Karelia, as well as Rostov Oblast, Sakhalin Oblast, Irkutsk Oblast, and Novosibirsk Oblast. This risk manifests due to both quantitative differences in the frequency of common allelic variants and the presence of rare alleles in specific regions, such as CYP2C9*29, CYP2C9*12, CYP2C19*8, CYP2D6*32, and CYP2D6*7.
Conclusions. The obtained results provide the basis for the development of domestic diagnostic panels and for implementing a differentiated approach to pharmacogenetic testing across various biogeographic groups within the country. The introduction of such panels must be accompanied by health economic evaluation for each drug whose effectiveness and safety depends substantially on the CYP2C9, CYP2C19, and CYP2D6 genotype.
Yudin V.S., Spektor E.D., Mamchur A.A., Ivanov M.V., Mitrofanov S.I., Kuzmina L.P., Bukhtiyarov I.V., Keskinov A.A., Yudin S.M., Kashtanova D.A. Allelic variants of CYP2C9, CYP2C19, CYP2D6 cytochromes in the Russian population: Prevalence and regional distribution. Extreme Medicine. 2026;28(1):37-50. https://doi.org/10.47183/mes.2025-371
Genotyping of drug-metabolizing enzymes, a significant proportion of which are cytochrome P450 isoenzymes, plays an essential role in the personalization of pharmacotherapy. According to the studies conducted among individuals of European descent, 96.8% carry at least one genetic variant in cytochrome P450 isoenzymes capable of influencing drug metabolism [1]. The CYP2C9, CYP2C19, and CYP2D6 isoenzymes are responsible for the metabolism of up to 45% of drugs undergoing biotransformation [2] and are classified among the so-called “very important pharmacogenes” (VIP) [3].
The CYP2C9 cytochrome isoenzyme, which constitutes approximately 20% of all P450 isoenzymes [4], mediates the metabolism of drugs such as warfarin and other coumarin anticoagulants, phenytoin, fluvastatin, torasemide, certain sartans, oral hypoglycemic agents (primarily sulfonylurea derivatives), and non-steroidal anti-inflammatory drugs (NSAIDs), as well as a significant number of endogenous substances and non-pharmacological xenobiotics [5]. The allelic variants CYP2C9*2 and CYP2C9*3 are prevalent in populations of European descent, thus having been extensively studied [6]; data on allelic distribution in other populations are being accumulating on a constant basis, revealing distinct characteristics of specific biogeographic groups.
Another pharmacogenetically significant isoenzyme — CYP2C19 — is a key enzyme in the biotransformation of clopidogrel, proton pump inhibitors, voriconazole, certain benzodiazepines, and antidepressants from the groups of selective serotonin reuptake inhibitors and tricyclic antidepressants [7]. The CYP2C19*2 and CYP2C19*3 variants correspond to a lack of enzyme activity, leading to a reduced rate of substrate biotransformation. For comparison, carriage of the CYP2C19*17 allele is associated with an increased enzyme activity and a higher rate of drug metabolism [7]. In the European population, along with the wild-type CYP2C19*1 variant, only the *2 and *17 variants are found with a relatively high frequency (>1%). The CYP2C19*3 allele is found primarily in East Asian populations, while individuals of African descent are characterized by significant allelic diversity of this enzyme, with the presence of variants such as *9, *13, *15, and *27 [6].
Another isoenzyme — CYP2D6 — has the broadest drug coverage and is the most polymorphic. PharmGKB lists over 180 allelic variants, a significant portion of which are either not annotated or have an annotation of unknown/uncertain function.1 The list of drugs metabolized with its participation includes antidepressants from various pharmacological groups, antipsychotics, opioid analgesics, tamoxifen, some beta-blockers, and antiarrhythmic agents [8]. Common alleles corresponding to normal enzyme activity, along with the wild-type *1, are *2 and *35. Alleles associated with decreased activity include *9, *17, *29, and *41, while those with absent activity include *3, *4, *5, *6, and *40. The CYP2D6*10 haplotype occupies an intermediate position between decreased and absent activity variants [8]. Furthermore, enzyme activity can be increased due to the multiplication of alleles with normal enzyme activity (*1xN, *2xN), which leads to an accelerated rate of substrate metabolism [8][9].
The scope of genetic variant testing is regulated by international guidelines developed by the Pharmacogenomics Working Group of the Association for Molecular Pathology (PGxWG AMP) [10–13]. These guidelines distinguish alleles recommended for testing into minimum (Tier 1) and extended (Tier 2) sets. Tier 1 includes variants with proven clinical impact and high population frequency, while Tier 2 comprises less common alleles.
Other international pharmacogenetic initiatives, such as the Clinical Pharmacogenetics Implementation Consortium (CPIC), the Dutch Pharmacogenetics Working Group (DPWG), and the European Medicines Agency (EMA), do not prescribe specific allele sets recommended for genotyping relevant cytochrome P450 isoenzymes. Instead, they focus on establishing genotype-dosing correlations and developing clinical decision-making algorithms based on genotype (CPIC, DPWG), or on regulatory aspects, standardizing terminology, and systematizing biomarkers in pharmacogenetic studies (EMA).
The current guidelines are predominantly based on data for Western populations and fail to account for the specific characteristics of Russia, where allele distribution may differ significantly due to the unique population structure of the country. Domestic equivalents of such guidelines are currently lacking, creating a risk of underestimating clinically significant variants in patients within the Russian Federation.
This study is aimed at determining the allelic polymorphism of cytochromes CYP2C9, CYP2C19, and CYP2D6 in the population of the Russian Federation, taking regional specificities into account.
The study was conducted using a population-based sample from the Genetic Database (GDB) of the Centre for Strategic Planning of the FMBA of Russia.2 The sample size comprised 121,442 individuals (57,752 (48.4%) men, mean age 50.3 ± 13.9 years; data presented as M ± SD) from 85 Russian federal subjects. For the analysis of regional allele frequency distribution, participants from Moscow and Moscow Oblast, St. Petersburg and Leningrad Oblast, Sevastopol and the Crimea were pooled. The recruitment criteria for the GDB participants are described in a previously published work [14]. For comparative analysis and the formation of region-specific diagnostic panels, regions with a sample size of 250 individuals or greater were selected (72 Russian regions).
Genomic DNA was extracted from whole blood samples using the MagAttract HMW DNA Kit (Qiagen, Germany) for high-molecular-weight DNA isolation with magnetic particles on automated robotic workstations. Whole-genome sequencing libraries were prepared using the Illumina DNA Prep reagent kit according to the manufacturer’s instructions (Document # 1000000025416 v10, Illumina, USA) with IDT-ILMN Nextera DNA UD Indexes Set A and Set B, followed by quality control. Whole-genome sequencing was performed on the Illumina NovaSeq 6000 platform using the S4 Reagent Kit (300 cycles) (Illumina, USA) for 2 × 150 bp paired-end reads.
During the demultiplexing stage, sequencing data in BCL format were converted to FASTQ format using Illumina bcl2fastq2 v2.20.0.422.3 Quality control of the sequencing run was performed using Illumina Sequencing Analysis Viewer v2.4.7,4 while read quality (FASTQ.GZ format) was assessed using the bioinformatic tool FastQC v0.11.9.5 Reads were aligned to the GRCh38.d1.vd1 reference genome6 using the Illumina DRAGEN Bio-IT Platform v07.021.510.3.5.7.7 Quality control of alignments (BAM format) was performed using DRAGEN, FastQC v0.11.9,8 samtools v1.13 [15], and mosdepth v0.3.1 [16]. All samples passed quality control based on key metrics. The final mean genome coverage per sample was at least 30x. Detection of small genetic variants (up to 50 bp) was performed using Illumina Strelka2 v2.9.10 [17]. The sample set was checked for duplicates using Picard CrosscheckFingerprints [18] with the built-in map file. The bioinformatic processing pipeline used was validated (F-score = 99.83%) against the HG001 reference genome provided by the Genome In A Bottle (GIAB) consortium (v.3.3.2) [19].
The presence of single nucleotide variants was determined from the VCF files generated during the small variant calling stage. Genotyping of CYP2C9, CYP2C19, and CYP2D6 was performed using the PAnno software [20].
Data processing and visualization were performed using the Python programming language v3.9, utilizing the pandas, numpy, matplotlib, seaborn, and scipy libraries, as well as the R programming language v4.4.1, with the dplyr and ggplot2 libraries.
Allele frequency was calculated as the number of target alleles divided by twice the number of observations. The frequency of heterozygous and homozygous carriage was determined as the ratio of the corresponding genotypes to the total number of observations. Variants with an allele frequency of 1% or more were considered significant for potential inclusion in the minimum diagnostic panel (Tier 1), while those with a frequency of 0.5% or more were considered for the extended panel (Tier 2).
To compare the allele frequencies identified in the study population with global data, the standardized system of biogeographical groups developed by PharmGKB and the Bustamante Lab [21] was used. This system comprises nine groups defined by global autosomal genetic structure: African/Afro-Caribbean, American, Central/South Asian, East Asian, European, Latino, Middle Eastern, Oceanian, and Sub-Saharan African. The data sources for this system are the “1000 Genomes” and “Human Genome Diversity Project” initiatives.
Based on the allele annotations provided in PharmGKB [3], an activity score (AS) for each of the CYP2C9, CYP2C19, and CYP2D6 isoenzymes was calculated for every sample in the cohort. The metabolic phenotype (e.g., normal, intermediate, poor; for CYP2C19 also rapid and ultrarapid) was assigned based on the AS according to established algorithms [22–25]. For analytical convenience, intermediate and poor metabolizers were combined into a group of “impaired metabolism”, while rapid and ultrarapid metabolizers (for CYP2C19) were combined into a group of “accelerated metabolism”.
For each region with a sample size of 250 individuals or greater, the proportion of impaired metabolizers for CYP2C9, CYP2C19, and CYP2D6 substrates was calculated, along with the proportion of accelerated metabolizers (for CYP2C19 only). Proportion estimates were accompanied by a 95% confidence interval (CI) calculated using the Wilson method.
Regions at risk were identified via interval estimation, specifically those where the carrier frequency of genotypes associated with altered metabolism of the studied enzymes exceeded the population level. Subsequently, using a z-test with correction for multiple comparisons (Benjamini-Hochberg procedure, FDR controlled at 5%), the frequencies of functionally significant alleles in these at-risk regions were compared against the overall population data.
The distribution of allele frequencies and carrier frequencies in the studied population sample for variants with a prevalence exceeding 0.5% are presented in Table 1.
Table 1. Prevalence rates of CYP2C9, CYP2C19, and CYP2D6 allelic variants in the general population with allele frequency > 0.5%
|
Allelic variant |
Allele frequency, % |
Carrier frequency, % |
Heterozygous carrier frequency in the sample, % |
Homozygous carrier frequency in the sample, % |
PGxWG AMP diagnostic guidelines |
|
CYP2C9 |
|||||
|
*1 |
81.31 |
96.38 |
30.13 |
66.24 |
Tier 1: *2, *3, *5, *6, *8, *11 Tier 2: *12, *13, *15 |
|
*2 |
9.59 |
18.2 |
17.23 |
0.97 |
|
|
*3 |
7.76 |
14.82 |
14.11 |
0.7 |
|
|
*29 |
0.98 |
1.91 |
1.88 |
0.04 |
|
|
CYP2C19 |
|||||
|
*1 |
52.99 |
77.63 |
49.11 |
28.52 |
Tier 1: *2, *3, *17 Tier 2: *4, *5, *6, *7, *8, *9, *10, *35 |
|
*17 |
25.55 |
44.19 |
37.2 |
6.99 |
|
|
*2 |
12.81 |
23.73 |
21.96 |
1.77 |
|
|
*38 |
7.5 |
14.36 |
13.69 |
0.67 |
|
|
*3 |
0.58 |
1.14 |
1.11 |
0.03 |
|
|
CYP2D6 |
|||||
|
*1 |
37.86 |
60.06 |
44.35 |
15.7 |
Tier 1: *2, *3, *4, *5, *6, *9, *10, *17, *29, *41 Tier 2: *7, *8, *12, *14, *15, *21, *31, *40, *42, *49, *56, *59 |
|
*2 |
18.13 |
32.06 |
27.84 |
4.22 |
|
|
*4 |
15.29 |
27.48 |
24.42 |
3.06 |
|
|
*35 |
8.98 |
16.64 |
15.32 |
1.32 |
|
|
*41 |
7.37 |
13.87 |
12.99 |
0.88 |
|
|
*10 |
3.68 |
6.5 |
5.64 |
0.86 |
|
|
*33 |
1.91 |
3.71 |
3.6 |
0.11 |
|
|
*9 |
1.51 |
2.94 |
2.86 |
0.08 |
|
|
*3 |
1.12 |
2.19 |
2.14 |
0.06 |
|
|
*6 |
0.9 |
1.76 |
1.73 |
0.04 |
|
|
*39 |
0.85 |
1.58 |
1.45 |
0.13 |
|
|
*59 |
0.68 |
1.32 |
1.28 |
0.04 |
|
Table compiled by the authors based on original data
Note: rows are sorted in descending order of allele frequency; alleles with a frequency of less than 1% are highlighted in green color.
For the CYP2C9 gene, the *2 and *3 variants, which occur with a frequency greater than 1%, appear to be prospective for inclusion in the minimum testing panel. The CYP2C9*29 allele could potentially be included in the extended testing panel recommended for the Russian population, as its occurrence exceeds 0.5% and its carrier frequency is over 1%.
Among CYP2C19* allelic variants that exceed the 1% prevalence threshold, along with the wild-type *1, are the *17, *2, and *38 alleles. However, CYP2C19*38 corresponds to normal enzyme activity, similar to the wild-type, therefore testing for its carriage is not justified. Thus, it is reasonable to include CYP2C19*2 and CYP2C19*17 in the minimum testing panel for CYP2C19* in the Russian Federation, while placing CYP2C19*3, which has a prevalence of less than 1%, into the extended diagnostic panel.
The CYP2D6* gene is characterized by significant allelic diversity. Among the variants frequent in the Russian population (*2, *3, *4, *9, *10, *33, *35, *41), those with a confirmed impact on enzyme activity are *3 (AS = 0), *4 (AS = 0), *9 (AS = 0.5), *10 (AS = 0.5), and *41 (AS = 0.5). These alleles are candidates for inclusion in the minimum diagnostic panel. Among the less common variants, but with a frequency exceeding 0.5%, those affecting the final enzyme activity include CYP2D6*6 (AS = 0) and CYP2D6*59 (AS = 0.5).
On the basis of frequency and functional criteria, minimum and extended diagnostic panels for genotyping the CYP2C9, CYP2C19, and CYP2D6 isoenzymes, relevant for the residents of the Russian Federation, are formulated (Fig. 1, Table 2).

Figure prepared by the authors based on original data
Fig. 1. Diagnostic panels for CYP2C9 and CYP2C19 genotyping in residents of the Russian Federation across specific regions: A — CYP2C9 allelic variants; regional groups and their corresponding optimal diagnostic panels are highlighted in blocks; B — CYP2C19 allelic variants; regional groups and their corresponding optimal diagnostic panels are highlighted in blocks; Ural Federal District (UFD) includes the Kurgan, Sverdlovsk, Tyumen, and Chelyabinsk Oblasts, as well as the Khanty-Mansi Autonomous Okrug and Yamalo-Nenets Autonomous Okrug; LR — Leningrad Oblast; the Central Federal District (CFD), excluding the Oryol, Tambov, Lipetsk, and Bryansk Oblasts, which were not included in the analysis due to a low number of observations
Table 2. Diagnostic panels for CYP2D6 genotyping in residents of specific regions of the Russian Federation
|
Region |
Minimum diagnostic panel of allelic variants |
Extended diagnostic panel |
|
General population |
*3, *4, *9, *10, *41 |
*6, *59 |
|
Kurgan Oblast |
*3, *4, *10, *41 |
*6, *9, *59 |
|
Tula Oblast Vladimir Oblast Saratov Oblast |
*3, *4, *6, *9, *10, *41, *59 |
– |
|
Karelia Bashkortostan |
*3, *4, *9, *10, *41, *59 |
*6 |
|
Smolensk Oblast |
*3, *4, *9, *10, *41 |
*59 |
|
Mordovia |
*3, *4, *6, *9, *10, *41 |
– |
|
Stavropol Oblast Nizhny Novgorod Oblast Belgorod Oblast Kaluga Oblast Penza Oblast Chelyabinsk Oblast Kemerovo Oblast Arkhangelsk Oblast Ivanovo Oblast Tver Oblast Perm Oblast Altai Oblast Irkutsk Oblast Zabaykalsky Krai Khabarovsk Oblast Khanty-Mansi Autonomous Okrug |
*3, *4, *6, *9, *10, *41 |
*59 |
|
Yaroslavl Oblast Amur Oblast |
*4, *6, *9, *10, *41 |
*3 |
|
Mari El |
*4, *10, *41 |
*3, *6, *9, *32 |
|
Kostroma Oblast |
*3, *4, *9, *10, *41, *59 |
*6, *32 |
|
Murmansk Oblast |
*3, *4, *10, *41 |
*6, *9 |
|
Dagestan Kabardino-Balkaria |
*4, *10, *41 |
*6, *9, *32 |
|
North Ossetia — Alania Adygea |
*4, *10, *41 |
*6, *9 |
|
Ingushetia |
*4, *7, *10, *41 |
– |
|
Chuvashia |
*4, *10, *41 |
*6, *9, *32, *59 |
|
Chechnya |
*4, *7, *10, *32, *41 |
– |
|
Tyva |
*4, *10, *41 |
– |
|
Sakha (Yakutia) Kalmykia |
*4, *10, *41 |
*3, *9 |
|
Buryatia |
*4, *10, *41 |
*3, *6, *9 |
|
Komi |
*3, *4, *6, *9, *10, *41 |
– |
|
Krasnodar Oblast |
*4, *6, *10, *41 |
*3, *59 |
|
Crimea Samara Oblast Orenburg Oblast Udmurtia Sakhalin Oblast |
*4, *9, *10, *41 |
*3, *6, *59 |
|
Tatarstan Kursk Oblast Kamchatka Oblast |
*4, *9, *10, *41 |
*3, *6 |
|
Novosibirsk Oblast Tyumen Oblast |
*4, *6, *9, *10, *41 |
*3, *59 |
Table compiled by the authors based on original data
Note: “–” no data available
Given that the genetic structures of individual Russian regions can vary significantly, this nationwide panel should be modified where necessary. Regions where the CYP2C9 allele distribution implied a different optimal diagnostic panel are highlighted in Figure 1A. The corresponding information for CYP2C19 and CYP2D6 is presented in Figure 1B and Table 2, respectively.
Most differences were characterized by the inclusion of the *29 allele in the minimum panel due to its frequency exceeding the 1% threshold. Furthermore, in the Republics of Chuvashia (6.32%) and Mari El (5.61%), its frequency surpassed the 5% threshold. However, some qualitative differences were also noted: the presence of the CYP2C9*11 variant in the residents of the Republic of Komi, and the CYP2C9*12 variant in the residents of the Republics of Dagestan and Chechnya.
For residents of a significant number of Russian regions, encompassing almost the entire Central and Northwestern Federal Districts, many regions of the North Caucasian District, and to a lesser extent other macro-regions, testing for the CYP2C19*3 allele is not relevant, even within the extended panel, as its frequency does not exceed the 0.5% threshold. Conversely, in the Republics of Sakha (Yakutia), Buryatia, Mari El, Bashkortostan, Kalmykia, and Tyva, this variant is sufficiently prevalent to recommend testing for its carriage as part of the minimum diagnostic panel. In terms of qualitative distinctions, the Yamalo-Nenets Autonomous Okrug and Zabaykalsky Krai stand out, where the CYP2C19*8 allele (AS = 0) is present with frequencies of 0.51% and 0.58%, respectively.
Due to the high allelic diversity of CYP2D6 and the presence of several alleles in the population structure with a prevalence of around 1%, the observed variety of diagnostic panel configurations is expected for combinatorial reasons. The *4, *10, and *41 alleles were consistently present in the minimum diagnostic panel across all studied groups, making them the most significant for CYP2D6 genotyping in the Russian population. The *3, *6, *9, and *59 alleles were typically included in one of the panels. Conversely, some regions (North Ossetia, Adygea, Sakha (Yakutia), Tyva, Kalmykia, and to a lesser extent Buryatia) were characterized by lower genetic diversity for this enzyme. Therefore, the use of less extensive diagnostic panels in these regions appears justified.
Qualitative differences include the presence of the *32 (AS = 0.25) and *7 (AS = 0) alleles in certain subpopulations. The CYP2D6*32 allele was found in the Republics of Mari El (0.85%), Dagestan (0.75%), Kabardino-Balkaria (0.79%), Chuvashia (0.67%), and Chechnya (1.43%), as well as in Kostroma Oblast (0.52%). A significant presence of the CYP2D6*7 allele was identified in Ingushetia (1.39%) and Chechnya (1.64%).
Several of the studied samples also contained rare alleles *74 and *117 with unknown function; on this basis, they were not included in the diagnostic panels. CYP2D6*74 was found in Khabarovsk (0.53%), Penza (0.6%) and Kaluga (0.52%) Oblasts, as well as in Zabaykalsky Krai (0.8%) and Kamchatka (0.69%). In turn, carriage of CYP2D6*117 with a frequency exceeding 0.5% was recorded in some northern regions (Arkhangelsk Oblast — 0.58%, Vologda Oblast — 0.56%, Karelia — 0.87%, Murmansk Oblast — 0.53%), as well as in Tyumen Oblast (0.58%) and Perm Oblast (0.68%).
A comparison of the allele frequencies of cytochromes CYP2C9, CYP2C19, and CYP2D6 identified in the study population with global data (Fig. 2) demonstrates that the frequency distribution of alleles for these enzymes in the Russian population sample is similar to that in the general European population. The CYP2C19*38 allele was not considered due to being classified as a sub-allele of the wild-type CYP2C19*1.001 in earlier nomenclatures [26] and, therefore, equated to CYP2C19*1 in the global resources used for allele frequency comparison.

Figure prepared by the authors based on original data
Fig. 2. Distribution of CYP2C9 (A), CYP2C19 (B), and CYP2D6 (C) isoenzyme alleles with a frequency > 1% in the Russian population across major biogeographical groups: allele frequencies (Y-axis) are presented as absolute values; the X-axis represents populations: RUS — Russian (sample from the present study); EUR — European and US residents of European ancestry; EAS — East Asian (China, Japan, Korea, partially Southeast Asia); NEA — Middle Eastern (Middle East, Caucasus, North Africa); SAS — South and Central Asian (Pakistan, India, Bangladesh); LAT — Latino, groups with mixed Indigenous American, European, and African ancestry; AAC — Afro-Caribbean; SSA — Sub-Saharan African; AME — Indigenous peoples of North and South America; OCE — Indigenous populations of Australia, Oceania, and New Guinea
The presence of the CYP2C9*29 allele (approximately 1%) in the Russian population sample is the most notable distinction. Indeed, it is poorly represented in the European population (0.03%) and absent in other biogeographical groups except for the East Asian group, where its prevalence is also low (0.22%). The CYP2D6*10 allele occurred significantly more frequently in the Russian population compared to the European population (3.7% vs. 1.57%, p = 0.000), which is likely attributable to influences from Middle Eastern (6.77%) and East Asian (42.84%) populations.
In the general population, the CYP2C9 genotype corresponding to normal metabolism of its substrates (AS = 2) was found with a frequency of 66.34%, intermediate metabolism (1 ≤ AS < 2) — 31.35%, and poor metabolism (AS < 1) — 2.31%. Thus, the total proportion of individuals with reduced CYP2C9 enzyme activity was 33.66%, or approximately one third of the population. The regional distribution of the proportion of individuals with reduced CYP2C9 enzyme activity is presented in Figure 4.
According to the obtained interval estimates, six federal subjects can be identified where the frequency of genotypes associated with reduced metabolism of CYP2C9 substrates is statistically significantly higher than the general population average. These high-risk regions are the Republics of Chechnya, Dagestan, Ingushetia, Kabardino-Balkaria, North Ossetia, Chuvashia, Mari El, Udmurtia, and Tatarstan. Conversely, Buryatia, Kalmykia, Tyva, and Sakha (Yakutia) seem favorable from this perspective. To clarify the pattern of allele distribution in the risk regions, a comparison of CYP2C9 variant frequencies with general population estimates was conducted (Fig. 3B, 3C).
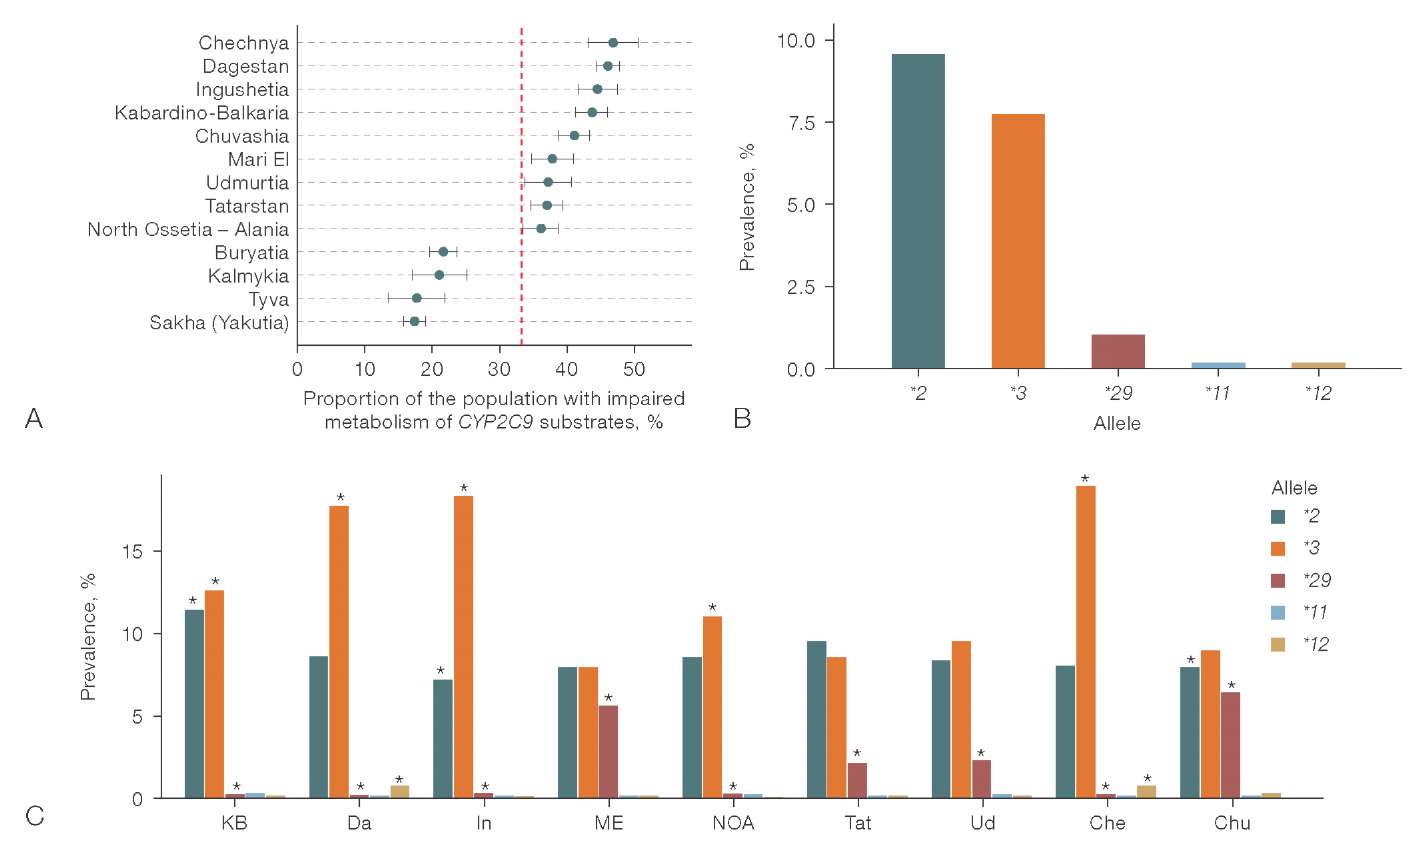
Figure prepared by the authors based on original data
Fig. 3. Population characteristics of CYP2C9 allelic polymorphism: A — Regional distribution of the proportion of carriers of CYP2C9 genotypes corresponding to slow metabolism of enzyme substrates (regions with a proportion differing from the population are presented); B — population allelic distribution of CYP2C9; C — allelic distribution of CYP2C9 in regions with increased frequency of slow/intermediate metabolism genotypes compared to the population
Note: the red dashed line represents the population estimate; KB — Kabardino-Balkaria; Da — Dagestan; In — Ingushetia; ME — Mari El; NOA — North Ossetia — Alania; Tat — Tatarstan; Ud — Udmurtia; Che — Chechnya; Chu — Chuvash; “*” — frequencies statistically significantly different from the population values (p-adj < 0.05).

Figure prepared by the authors based on original data
Fig. 4. Population characteristics of CYP2C19 allelic polymorphism: A — regional distribution of CYP2C19 metabolic phenotypes (regions with a proportion differing from the population are presented).; B — population allele distribution of CYP2C19; C — allelic distribution of CYP2C19 in regions with increased frequency of slow/intermediate metabolism genotypes compared to the population
Note: Ty — Tyva; SYa — Sakha (Yakutia); Kal — Kalmykia; B — Buryatia; Kar — Karelia; SR — Sakhalin Oblast; NR — Novosibirsk Oblast; IR — Irkutsk Oblast; “*” — frequencies statistically significantly different from the population values (p-adj < 0.05).
The obtained results demonstrated sufficient heterogeneity among the identified high-risk regions regarding the contribution of specific allelic variants to the increased likelihood of carrying genotypes for impaired CYP2C9 substrate metabolism. This risk was driven by an increased carrier frequency of the CYP2C9*3 allele in the Republics of Chechnya (18.89%, p-adj = 9.4 × 10⁻²⁷), Kabardino-Balkaria (12.68%, p-adj = 3.8 × 10⁻¹³), Dagestan (17.69%, p-adj = 1.7 × 10–89), Ingushetia (18.28%, p-adj = 3.1 × 10–40), and North Ossetia (11.04%, p-adj = 9.3 × 10⁻⁵). Additionally, Chechnya and Dagestan showed a somewhat higher representation of the CYP2C9*12 allele (0.71%, p-adj = 2.1 × 10⁻¹⁹ and 0.04%, p-adj = 8.3 × 10⁻²², respectively). Conversely, the CYP2C9*29 allele was relatively highly prevalent in the Republics of Mari El (5.61%, p-adj = 1.1 × 10–43), Chuvashia (6.32%, p-adj = 3.3 × 10–104), Tatarstan (2.15%, p-adj = 2.5 × 10⁻⁵), and Udmurtia (2.17%, p-adj = 0.009), while the prevalence of the *2 and *3 alleles in these regions was comparable to the general population.
In the sample under study, the majority of individuals had a normal (37.26%) or rapid (30.38%) metabolic phenotype for CYP2C19 substrates. The proportion of carriers of intermediate metabolism genotypes was 23.26%, ultrarapid (*17/*17) — 6.99%, and poor — 2.11%. The combined proportions of carriers of impaired (intermediate + poor) and accelerated (rapid + ultrarapid) metabolism genotypes were 25.37% and 37.37%, respectively. Regional variations in the proportions of accelerated and impaired metabolizers are presented in Figure 4A.
Tyva, Yakutia (Sakha), Kalmykia, and Buryatia were characterized by a substantial decrease in the proportion of individuals with the accelerated metabolism phenotype and a simultaneous significant increase in the percentage of impaired metabolizers. The latter also holds true, although to a lesser extent, for Sakhalin Oblast, Irkutsk Oblast, Novosibirsk Oblast, and Karelia. Regions such as Ingushetia, Chechnya, Kabardino-Balkaria, and Dagestan had lower proportions of both accelerated and impaired metabolizers of CYP2C19 substrates compared to the population averages. An increased representation of the rapid/ultrarapid metabolic phenotype was observed among residents of Chuvashia and Altai, Smolensk, Moscow, Rostov, Tver, Leningrad, Tula, Kemerovo, Voronezh, Ivanovo, Arkhangelsk, and Pskov Oblasts.
Variations in the proportion of carriers of the rapid or ultrarapid metabolism phenotype can only be attributed to changes in the prevalence of the *17 allele, as being the sole allele associated with increased CYP2C19 enzyme activity. For regions with an increased prevalence of the impaired metabolism phenotype (Tyva, Yakutia (Sakha), Kalmykia, Buryatia, Karelia, Sakhalin, Novosibirsk, and Irkutsk Oblasts), the nature of the allelic distribution was detailed in comparison with the population average (Fig. 4B, 4C).
The obtained results of allelic variant distribution in regions at risk for impaired metabolism of CYP2C19 substrates indicate that this risk is realized not through the presence of rare alleles in these geographic groups, but due to a higher representation of slow alleles that are also prevalent in the general population, namely CYP2C19*3 and, to a lesser extent, CYP2C19*2.
The population sample under study was characterized by a normal metabolism of CYP2D6 substrates in 91.72% of cases. The intermediate metabolism phenotype was observed in 4.32% of instances, and the poor metabolism phenotype in 3.97%. The overall proportion of impaired metabolism in the population was 8.29%; the corresponding data are presented in Figure 5A.

Figure prepared by the authors based on original data
Fig. 5. Allele distribution for CYP2D6 in Rostov Region, Dagestan, and Kabardino-Balkaria: A — regional distribution of the proportion of CYP2D6 genotype carriers corresponding to slow metabolism of enzyme substrates (regions with a proportion differing from the population are presented); B — population-level allelic distribution of CYP2D6; C — allelic distribution of CYP2D6 in regions with elevated carrier frequency of slow/intermediate metabolism genotypes compared to the population baseline
Note: RR — Rostov Oblast; KB — Kabardino-Balkaria; D — Dagestan; “*” — frequencies statistically significantly different from the population values (p-adj < 0.05).
Residents of Tyva, Yakutia (Sakha), Kalmykia, Chuvashia, Udmurtia, Buryatia, Mari El, Bashkortostan, and Arkhangelsk Oblast had a low risk of carrying a genotype corresponding to impaired metabolism of the enzyme substrates. A somewhat higher proportion of intermediate/poor metabolizers was recorded in Rostov Oblast (9.84%), Dagestan (10.17%), and Kabardino-Balkaria (10.05%). The allele distribution for CYP2D6 in these regions is presented in Figures 5B and 5C.
When comparing the frequency of individual alleles in the high-risk regions with the general population estimates, it was found that Kabardino-Balkaria has a higher frequency of CYP2D6*41 (10.46%, p-adj = 1.3 × 10⁻⁵) and CYP2D6*10 (4.92%, p-adj = 0.022). In Dagestan, a higher frequency of the CYP2D6*2 (20.96%, p-adj = 1.5 × 10⁻⁴) and CYP2D6*4 (17.98%, p-adj = 1.5 × 10⁻⁴) alleles is observed. In Rostov Oblast, after correction for multiple comparisons, no significant differences in the frequency of major alleles were detected.
The results of our study, obtained from a large and representative population sample, contribute to the understanding of CYP2C9, CYP2C19, and CYP2D6 allelic polymorphism in the Russian population and provide a basis for specifying the scope of pharmacogenetic testing at the regional level. The widespread implementation of such testing, which is an integral part of personalized medicine, is impossible without the creation of accessible diagnostic tools. These tools, in turn, are limited by a predefined set of variants they can detect. Our results demonstrate that the panels formulated in the AMP guidelines are not optimal for use in Russian clinical practice.
The minimum allele testing panel for CYP2C9 proposed by AMP covers haplotypes *2, *3, *5, *6, *8, and *11, while the extended panel includes *12, *13, and *15 [11]. However, in the Russian population, all these variants, except for *2 and *3, have a frequency of less than 0.5%, making testing for their carriage impractical. The AMP guidelines are primarily oriented toward residents of the United States and Europe. The inclusion of most of these alleles in these recommendations is likely due to their relatively high prevalence in individuals of African ancestry [6]. In contrast, CYP2C9*29, which is found in approximately 2% of the Russian population and is associated with reduced CYP2C9 enzyme activity (AS = 0.5), is not included even in the extended AMP recommendation panel.
The minimum CYP2C19 genotyping panel proposed by AMP includes haplotypes *2, *3, and *17 [12]. However, according to our data, CYP2C19*3 warrants inclusion in the minimum diagnostic panel only in specific regions, not for the general population, as its prevalence is less than 1%. Due to the lack of a functional role, this variant was not included in our proposed diagnostic panels for CYP2C19. The alleles suggested by AMP for extended diagnostics (*4, *5, *6, *7, *8, *9, *10, *35) do not exceed the 0.5% prevalence threshold in the Russian population. Therefore, the rationale for their inclusion in extended domestic diagnostic panels appears questionable.
As far as CYP2D6 genotyping recommendations are concerned, the common ground is the set of alleles *2, *3, *4, *9, *10, and *41. Haplotypes *5, *6, *17, and *29 are not relevant for the Russian population, yet they are included in the AMP minimum panel [10], likely due to their high frequency in African and Latino populations. Potential candidates for inclusion in the extended diagnostic panel for the Russian population are the *6 (AS = 0) and *59 (AS = 0.5) alleles, as they are not exceptionally rare and are characterized by an impact on enzyme activity. Among these, only the CYP2D6*59 allele is present in the extended list proposed by AMP, while over ten other alleles irrelevant for residents of Russia are listed.
Regional differences in the allele structure reflect the genetic heterogeneity of the Russian population. In the population of Komi, the CYP2C9*11 variant (AS = 0.5) met the criteria for inclusion in the extended diagnostic panel (prevalence 0.71%). According to global data, this variant is found only in individuals of Sub-Saharan African ancestry [21] and is included in the AMP minimum panel. A similar situation is observed for the CYP2C9*12 variant (AS = 0.5), registered in residents of Dagestan (0.75%) and Chechnya (0.72%). This variant is not found in global populations except for the admixed Middle Eastern population, where it has an extremely low prevalence (less than 0.1%) [21].
Among the CYP2C19 haplotypes that are extremely rare in global populations, we identified the *8 variant (AS = 0) in residents of the Yamalo-Nenets Autonomous Okrug (0.51%) and Zabaykalsky Krai (0.58%). Notably, this allele is not detected at all in individuals of East Asian ancestry, which might be expected given the geography of these regions, and its inclusion is not recommended by AMP even in the extended panel. The CYP2D6*32, CYP2D6*74, and CYP2D6*117 haplotypes, present in specific regions of the Russian Federation, are not included in the AMP diagnostic panels. CYP2D6*32 is characterized by reduced enzyme activity (AS = 0.25) and is exceptionally rare, found only in the general European (0.3%), Central/South Asian (0.2%), and Southern African (0.04%) populations.9 However, its prevalence in Chechnya exceeds 1%, and in the Republics of Mari El, Chuvashia, Dagestan, and Kabardino-Balkaria, it ranges 0.5–1%.
The functional role of CYP2D6*74 and CYP2D6*117 remains undefined. However, according to CPIC guidelines, carriers of these variants are classified as intermediate metabolizers [22][27]. We did not include these variants in the recommended diagnostic panels due to insufficiently robust evidence supporting their functional significance; however, this position regarding the necessity of their inclusion may be revised as more data accumulates. CYP2D6*74, which occurs with a frequency of 0.5–0.6% in Khabarovsk Oblast, Zabaykalsky Krai, Kamchatka, Penza Oblast, and Kaluga Oblast, is not documented in any biogeographical group except for individuals of African ancestry. Conversely, CYP2D6*117 is observed exclusively in Europeans with a frequency of less than 1%.10
The largest Russian biotech companies manufacturing reagent components for polymerase chain reaction include primers for detecting CYP2C9*2 and CYP2C9*3 carriage in their product lines. Consequently, accounting for the CYP2C9*29 allele, which is relevant for the Russian population, and to a lesser extent CYP2C9*12, is currently only feasible through whole-genome sequencing and not by routine diagnostic methods. For CYP2C19, the commonly available testing panel (CYP2C19*2, CYP2C19*3, CYP2C19*17) covers the necessary variants for most regions, with the exception of the Yamalo-Nenets Autonomous Okrug and Zabaykalsky Krai, where testing for CYP2C19*8 carriage holds relative relevance as part of extended diagnostics. Given the high variability of the CYP2D6 gene, the required diagnostic scope is also quite extensive, encompassing the detection of alleles *3, *4, *10, *41, *6, and *9. Furthermore, private laboratories also perform testing for gene deletion (*5) and duplication. The optimal testing panel for the Russian population should also include the *59 allele, and in specific regions, the *32 and *7 alleles.
An important limitation of our study is the analysis of only single nucleotide polymorphisms and haplotypes predicted based on their basis. Structural variants, such as large deletions (e.g., CYP2D6*5) or gene copy number variations (e.g., CYP2D6*xN), were not considered due to the inability to accurately determine gene copy number or other major structural variations from short-read whole-genome sequencing data with an average coverage of 30–40x. This may have led to an underestimation of the frequencies of some clinically significant alleles where structural variants contribute substantially to the metabolic phenotype. According to the literature, CYP2D6*xN is prevalent in East Asian populations [6]; therefore, a similar pattern might be expected in the eastern regions of Russia.
Furthermore, it should be noted that the proposed regional panels serve as an important basis for personalizing pharmacotherapy. However, their implementation into clinical practice requires prior health-economic evaluation. It is crucial to assess the balance between the costs of genetic testing and the potential harm from failing to account for functionally significant variants. For drugs with a narrow therapeutic index, pre-emptive genotyping may be economically justified provided it has a favorable tolerability profile and entails no serious threats; conversely, it might be considered excessive when the drug proves ineffective. Therefore, when developing clinical guidelines, not only population genetic data must be considered, but also the severity and risks of the preventable adverse drug reactions, cost parameters, and clinical outcomes for specific medications.
In general, the Russian population shares similarities with the European population regarding the allelic polymorphism of CYP2C9, CYP2C19, and CYP2D6. However, there are distinctive features both at the general population level and within specific regions, demonstrating significant population heterogeneity. This underscores the importance of not only developing domestic diagnostic panels but also adopting a differentiated approach to pharmacogenetic testing across various biogeographic groups within the country.
The presence of alleles considered exceptionally rare by global standards — such as CYP2C9*29, CYP2C9*11, CYP2C9*12, CYP2C19*8, CYP2D6*32, CYP2D6*7, CYP2D6*74, and CYP2D6*117 — has been established within the population structure or in specific biogeographic groups of the Russian Federation.
The implementation of the proposed diagnostic panels into clinical practice must be accompanied by health-economic evaluation for each drug whose effectiveness and safety depends significantly on the CYP2C9, CYP2C19, and CYP2D6 genotype.
Authors’ contributions. All authors confirm that their contributions meet the ICMJE authorship criteria. The largest contribution was distributed as follows: Vladimir S. Yudin — conceptualization; Ekaterina D. Spektor — methodology, manuscript creation; Aleksandra A. Mamchur — visualization; Mikhail V. Ivanov — formal analysis; Sergey I. Mitrofanov — software; Ludmila P. Kuzmina — resources; Igor V. Bukhtiyarov — research; Anton A. Keskinov — project administration; Sergey M. Yudin — research management; Daria A. Kashtanova — manuscript editing.
1. PharmGKB. URL: https://www.pharmgkb.org
2. Genetic Database (GDB). FMBA of Russia. Application v1.1.3 of 17.03.2025. Database v59.1 of 03.10.2024. URL: https://gdbpop.nir.cspfmba.ru (access date 02.08.2025) (In Russ.).
3. bcl2fastq and bcl2fastq2 Conversion Software Downloads [Electronic resource]. URL: https://emea.support.illumina.com/sequencing/sequencing_software/bcl2fastq-conversion-software/downloads.html
4. Sequencing Analysis Viewer Support [Electronic resource]. URL: https://support.illumina.com/sequencing/sequencing_software/sequencing_analysis_viewer_sav.html
5. Babraham Bioinformatics — FastQC A Quality Control tool for High Throughput Sequence Data [Electronic resource]. URL: https://www.bioinformatics.babraham.ac.uk/projects/fastqc/
6. GDC Reference Files | NCI Genomic Data Commons [Electronic resource]. URL: https://gdc.cancer.gov/about-data/gdc-data-processing/gdc-reference-files
7. DRAGEN secondary analysis | Software for NGS data analysis [Electronic resource]. URL: https://www.illumina.com/products/by-type/informatics-products/dragen-secondary-analysis.html
8. Babraham Bioinformatics — FastQC A Quality Control tool for High Throughput Sequence Data [Electronic resource]. URL: https://www.bioinformatics.babraham.ac.uk/projects/fastqc/
9. PharmGKB. URL: https://www.pharmgkb.org
10. Ibid.
1. Dawes M, Aloise MN, Ang S, Cullis P, Dawes D, Fraser R, et al. Introducing pharmacogenetic testing with clinical decision support into primary care: a feasibility study. CMAJ Open. 2016;4(3):E528–34. https://doi.org/10.9778/cmajo.20150070
2. Baltzer Houlind M, Hansen L, Iversen E, Rasmussen HB, Larsen JB, Jorgensen S, et al. Pharmacogenetic testing of CYP2D6, CYP2C19 and CYP2C9 in Denmark: Agreement between publicly funded genotyping tests and the subsequent phenotype classification. Basic and Clinical Pharmacology and Toxicology. 2024;134(5):756–63. https://doi.org/10.1111/bcpt.13990
3. Barbarino JM, Whirl-Carillo M, Altman RB, Klein TE. PharmGKB: A worldwide resource for pharmacogenomic information. WIREs. 2018;10(4):e1417. https://doi.org/10.1002/wsbm.1417
4. Zhang H-F, Wang H-H, Gao N, Wei JY, Tian X, Zhao Y, et al. Physiological Content and Intrinsic Activities of 10 Cytochrome P450 Isoforms in Human Normal Liver Microsomes. Journal of Pharmacology and Experimental Therapeutics. 2016;358(1):83–93. https://doi.org/10.1124/jpet.116.233635
5. Daly AK, Rettie AE, Fowler DM, Miners JO. Pharmacogenomics of CYP2C9: Functional and Clinical Considerations. Journal of Personalized Medicine. 2017;8(1):1. https://doi.org/10.3390/jpm8010001
6. Zhou Y, Ingelman-Sundberg M, Lauschke VM. Worldwide Distribution of Cytochrome P450 Alleles: A Meta-analysis of Population-scale Sequencing Projects. Clinical Pharmacology and Therapeutics. 2017;102(4):688–700. https://doi.org/10.1002/cpt.690
7. Shubbar Q, Alchakee A, Issa KW, Adi AJ, Shorbagi AI, Saber-Ayad M. From genes to drugs: CYP2C19 and pharmacogenetics in clinical practice. Frontiers in Pharmacology. 2024;15:1326776. https://doi.org/10.3389/fphar.2024.1326776
8. Pratt VM, Scott SA, Pirmohamed M, Esquivel B, Kattman BL, Malheiro AJ, ed. Medical Genetics Summaries. Bethesda (MD): National Center for Biotechnology Information (US);2012.
9. Gong L, Klein CJ, Caudle KE, Moyer AM, Scott SA, Whirl-Carillo M, et al. Integrating Pharmacogenomics into the Broader Construct of Genomic Medicine: Efforts by the ClinGen Pharmacogenomics Working Group (PGxWG). Clinical Chemistry. 2025;71(1):36–44. https://doi.org/10.1093/clinchem/hvae181
10. Pratt VM, Cavallari LH, Del Tredici AL, Hachad H, Ji Y, Moyer AM, et al. Recommendations for Clinical CYP2C9 Genotyping Allele Selection: A Joint Recommendation of the Association for Molecular Pathology and College of American Pathologists. Journal of Molecular Diagnostics. 2019;21(5):746–55. https://doi.org/10.1016/j.jmoldx.2019.04.003
11. Pratt VM, Del Tredici AL, Hachad H, Ji Y, Kalman LV, Scott SA, et al. Recommendations for Clinical CYP2C19 Genotyping Allele Selection: A Report of the Association for Molecular Pathology. Journal of Molecular Diagnostics. 2018;20(3):269–76. https://doi.org/10.1016/j.jmoldx.2018.01.011
12. Pratt VM, Cavallari LH, Fulmer ML, Gaedigk A, Hachad H, Ji Y, et al. CYP3A4 and CYP3A5 Genotyping Recommendations: A Joint Consensus Recommendation of the Association for Molecular Pathology, Clinical Pharmacogenetics Implementation Consortium, College of American Pathologists, Dutch Pharmacogenetics Working Group of the Royal Dutch Pharmacists Association, European Society for Pharmacogenomics and Personalized Therapy, and Pharmacogenomics Knowledgebase. Journal of Molecular Diagnostics. 2023;25(9):619–29. https://doi.org/10.1016/j.jmoldx.2023.06.008
13. Gusakova M, Dzhumaniazova I, Zelenova E, Kashtanova D, Ivanov M, Mamchur A, et al. Prevalence of the cancer-associated germline variants in Russian adults and long-living individuals: using the ACMG recommendations and computational interpreters for pathogenicity assessment. Frontiers in Oncology. 2024;14:1420176. https://doi.org/10.3389/fonc.2024.1420176
14. Li H, Handsaker B, Wysoker A, Fennel T, Ruan J, Homer N, et al. The Sequence Alignment/Map format and SAMtools. Bioinformatics. 2009;25(16):2078–9. https://doi.org/10.1093/bioinformatics/btp352
15. Pedersen BS, Quinlan AR. Mosdepth: quick coverage calculation for genomes and exomes. Bioinformatics. 2018;34(5):867–8. https://doi.org/10.1093/bioinformatics/btx699
16. Kim S, Scheffler K, Halpern AL, Bekritsky MA, Noh E, Kallberg M, et al. Strelka2: fast and accurate calling of germline and somatic variants. Nature Methods. 2018;15(8):591–4. https://doi.org/10.1038/s41592-018-0051-x
17. Najafov J, Najafov A. CrossCheck: an open-source web tool for high-throughput screen data analysis. Scientific Reports. 2017;7(1):5855. https://doi.org/10.1038/s41598-017-05960-3
18. Krusche P, Trigg L, Boutros PC, Mason CE, De La Vega FM, Moore BL, et al. Best practices for benchmarking germline small-variant calls in human genomes. Nature Biotechnology. 2019;37(5):555–60. https://doi.org/10.1038/s41587-019-0054-x
19. Liu Y, Lin Z, Chen Q, Chen Q, Sang L, Wang Y, et al. PAnno: A pharmacogenomics annotation tool for clinical genomic testing. Frontiers in Pharmacology. 2023;14:1008330. https://doi.org/10.3389/fphar.2023.1008330
20. Huddart R, Fohner AE, Whirl-Carillo M, Wojcik GL, Gignoux CR, Popejoy AB, et al. Standardized Biogeographic Grouping System for Annotating Populations in Pharmacogenetic Research. Clinical Pharmacology and Therapeutics. 2019;105(5):1256–62. https://doi.org/10.1002/cpt.1322
21. Karnes JH, Rettie AE, Somogyi AA, Huddart R, Fohner AE, Formea CM, et al. Clinical Pharmacogenetics Implementation Consortium (CPIC) Guideline for CYP2C9 and HLA-B Genotypes and Phenytoin Dosing: 2020 Update. Clinical Pharmacology and Therapeutics. 2021;109(2):302–9. https://doi.org/10.1002/cpt.2008
22. Bousman CA, Stevenson JM, Ramsey LB, Sangkuhl K, Hicks JK, Strawn JR, et al. Clinical Pharmacogenetics Implementation Consortium (CPIC) Guideline for CYP2D6, CYP2C19, CYP2B6, SLC6A4, and HTR2A Genotypes and Serotonin Reuptake Inhibitor Antidepressants. Clinical Pharmacology and Therapeutics. 2023;114(1):51–68. https://doi.org/10.1002/cpt.2903
23. Hicks JK, Sangkuhl K, Swen JJ, Ellingrod VL, Muller DJ, Shimoda K, et al. Clinical pharmacogenetics implementation consortium guideline (CPIC) for CYP2D6 and CYP2C19 genotypes and dosing of tricyclic antidepressants: 2016 update. Clinical Pharmacology and Therapeutics. 2017;102(1):37–44. https://doi.org/10.1002/cpt.597
24. Lee CR, Luzum JA, Sangkuhl K, Gammal RS, Sabatine MS, Stein CM, et al. Clinical Pharmacogenetics Implementation Consortium Guideline for CYP2C19 Genotype and Clopidogrel Therapy: 2022 Update. Clinical Pharmacology and Therapeutics. 2022;112(5):959–67. https://doi.org/10.1002/cpt.2526
25. Botton MR, Whirl-Carillo M, Del Tredici AL, Sangkuhl K, Cavallari LH, Agundez JAG, et al. PharmVar GeneFocus: CYP2C19. Clinical Pharmacology and Therapeutics. 2021;109(2):352–66. https://doi.org/10.1002/cpt.1973
26. Bousman CA, Stevenson JM, Ramsey LB, Sangkuhl K, Hicks JK, Strawn JR, et al. Clinical Pharmacogenetics Implementation Consortium (CPIC) Guideline for CYP2D6, CYP2C19, CYP2B6, SLC6A4, and HTR2A Genotypes and Serotonin Reuptake Inhibitor Antidepressants. Clinical Pharmacology and Therapeutics. 2023;114(1):51–68. https://doi.org/10.1002/cpt.2903
Vladimir S. Yudin, Cand. Sci. (Biol.)
Moscow
Ekaterina D. Spektor, Cand. Sci. (Med.)
Moscow
Aleksandra A. Mamchur
Moscow
Mikhail V. Ivanov
Moscow
Sergey I. Mitrofanov, Cand. Sci. (Biol.)
Moscow
Ludmila P. Kuzmina, Dr. Sci. (Med.), Professor
Moscow
Igor V. Bukhtiyarov, Dr. Sci. (Med.), Professor
Moscow
Anton A. Keskinov, Cand. Sci (Med.)
Moscow
Sergey M. Yudin, Dr. Sci. (Med.), Professor
Moscow
Daria A. Kashtanova, Cand. Sci. (Med.)
Moscow
Yudin V.S., Spektor E.D., Mamchur A.A., Ivanov M.V., Mitrofanov S.I., Kuzmina L.P., Bukhtiyarov I.V., Keskinov A.A., Yudin S.M., Kashtanova D.A. Allelic variants of CYP2C9, CYP2C19, CYP2D6 cytochromes in the Russian population: Prevalence and regional distribution. Extreme Medicine. 2026;28(1):37-50. https://doi.org/10.47183/mes.2025-371
10 bld. 1 Pogodinskaya Str., Moscow, Russia 119121
tel.: +7 (495) 540-61-71, ext.: 4190, 4191, 4192
E-mail: Extrememedicine@cspfmba.ru
Processing of personal data