


Contents
Scroll to:
https://doi.org/10.47183/mes.2024-26-3-5-14
Scroll to:
Introduction. One of the techniques used in retrospective biodosimetry according to the fluorescence in situ hybridization (FISH) method involves the estimation of stable chromosome aberrations (translocations) in human peripheral blood T-lymphocytes. In the case of uniform external and internal exposure, the interpretation of FISH data does not pose any problem, since the dose to T-lymphocytes that effects the translocation frequency can be simply interpreted as the dose to other organs and tissues. However, when the internal exposure is non-uniform and the doses to the organs differ by an order of magnitude, conversion from frequency of translocation to dose estimates becomes a complicated task.
Objective. To review the main parameters necessary for the retrospective assessment of doses using the FISH method in the case of internal uneven and prolonged β-irradiation.
Findings. The present analytical review considers problems associated with determining the following parameters: (1) Frequency of radiation-induced and background translocations; (2) Conversion factors from the frequency of radiation-induced translocations to the dose to T-lymphocytes (α); (3) Conversion factors from the dose to T-lymphocytes (cytogenetic dose) to the dose to critical organs and tissues (Borg ), which depend on age at the time of exposure. General approaches and estimates of (α) based on the construction of in vivo and in vitro calibration curves for external and internal exposure were analyzed. The dose-accumulation features in different T-cell populations from prolonged internal non-uniform exposure (using 90Sr as an example) were considered in terms of the applicability of the model approach to assessing accumulated doses. Uncertainties of dose estimates in retrospective biodosimetry are discussed and further research directions proposed.
Conclusions. In the case of non-uniform internal exposure with a low dose rate, converting translocation frequency to dose estimates becomes a complex task. The α and Borg conversion coefficients, which are derived from independent data sets, can be based on various approaches, including modelling. Currently, approaches to assessing their uncertainties, as well as the uncertainties of the dose obtained using the FISH method, remain undeveloped. Therefore, these coefficients require further studies.
Tolstykh E.I., Akhmadullina Y.R., Sharagin P.A., Shishkina E.A., Akleyev A.V. Retrospective biodosimetry: Conversion of frequency of chromosomal translocations into organ doses. Extreme Medicine. 2024;26(3):5-14. https://doi.org/10.47183/mes.2024-26-3-5-14
In cases of radiation exposure when a dosimeter was not available at the time of radiation exposure, retrospective biodosimetry can be used to reconstruct the radiation dose. One of the available biodosimetry approaches is based on the accounting of stable chromosomal aberrations (translocations) in human peripheral blood T-lymphocytes [1–3]. The application of this method is based on the following assumptions: the frequency of chromosomal translocations in T-lymphocytes is proportional to the exposure dose; the frequency remains constant for a long time (does not decrease with time); the radiation dose received by T-lymphocytes resulting in the formation of translocations corresponds to the dose of exposure to other organs and tissues, in particular to red bone marrow (RBM). The latter postulate is true in the case of uniform external or internal exposure. However, in case of non-uniform internal irradiation, for example, due to 89,90Sr, when doses to the RBM and other organs may differ by an order of magnitude, difficulties arise when interpreting the results of cytogenetic methods. This problem has been discussed in detail in a number of reviews [1–2]. For the purposes of biodosimetry, a model of T-lymphocyte exposure was developed in the case of 89,90Sr accumulation in mineralized tissues of the human body [4–6].
The fluorescence in situ hybridization (FISH) method is used to estimate the frequency of translocations in the cell. The main parameters required for retrospective dose estimation using FISH in case of internal non-uniform and prolonged β-irradiation are as follows.
(1) The number of yi translocations in ncell, counted in T-lymphocytes of a subject or a group of subjects is estimated using the FISH method. The characteristics of application and requirements for unification of the method are described in a number of regulatory documents [1][7]. To estimate the dose level, the translocation frequency (μi) is used; this should be presented per one genomic equivalent (Genomic Equivalent GE) — or, according to an alternative terminology, per one cell equivalent (Cell Equivalent CE). The conversion factor (Gj ) from the number of counted cells (metaphases) ncell to the number of genomic equivalents nge depends on the set of stained chromosomes and the type of staining (single-color or multicolor). If 24-color staining is used, no conversion to GE is required.
(2) Background (non-radiation) translocation frequency μ0(τ) depending on age. Here, since translocations may occur under the influence of other (non-radiation) unfavorable endogenous and exogenous factors, correction for background values (subtraction of background values) is necessary. The number of translocations in T-lymphocytes accumulates with age over an individual’s lifetime. According to the scientific literature, sex does not have a significant effect on the formation of translocations; the influence of smoking and alcohol is also insignificant. The dependence of translocation frequency obtained in a joint international study of unexposed donors in terms of the number of translocations per GE is used as already known background values [8].
(3) Coefficients of the dose-effect relationship (C — free term, α — linear coefficient, β — quadratic coefficient), whose combination permits age-adjusted translocation frequency μi_age to be transposed onto the dose absorbed in T-lymphocytes (DL). The coefficients are determined on the basis of the calibration curve (linear-quadratic or linear). For the construction of the calibration curve, the reliability of radiation dose estimation and uniformity of translocation counting criteria are of fundamental importance. The shape and parameters of the calibration curve depend on the type of radiation (linear energy transfer LET); sparsely ionizing gamma and beta radiation are dependent on the dose rate. Calibration curves are discussed in detail in the literature [1][7][9].
(4) Conversion factor (Brbm) from lymphocyte dose (DL) to red bone marrow dose (Drbm). For osteotropic 89,90Sr, this coefficient depends on age at the time of irradiation onset (τ1) and time following irradiation onset (τs – τ1), where τs is the age of the donor at the time of blood collection. In addition, the coefficient depends on sex due to variable strontium metabolism and its accumulation in bone tissue [10].
The purpose of this analytical review is to consider the main parameters1 that are necessary for retrospective dose estimation using the FISH method in the case of internal nonuniform and prolonged β-irradiation.
For good reproducibility of the biodosimetry method, it is important to unambiguously define the types of chromosomal translocations that are considered. Radiation cytogenetics uses different nomenclature approaches, typically PAINT (Protocol for Aberration Identification Nomenclature Terminology) [11], S&S (Savage and Simpson) [12]), and a combined approach using International System for Human Cytogenomic Nomenclature (ISCN) medical genetics terminology [13]. In the Russian-language literature, this leads to a large number of synonyms for translocations.
Under the action of sparsely ionizing β-radiation characteristic of 89,90Sr, most of the registered translocations are reciprocal (synonyms: complete, bilateral, two-way). In this case, there is a mutual exchange of end sites between two non-homologous chromosomes without loss of genetic material. Despite the involvement of fact that two chromosomes, reciprocal translocation is considered as a single event, i.e., one translocation. A small proportion are nonreciprocal (incomplete, unilateral, one-way) translocations, when the transfer of material occurs only from one nonhomologous chromosome to another — i.e., unidirectionally — and is counted as a single event. It has been suggested [1][14][15] that an incomplete translocation may actually be complete, but that the second chromosome segment involved in the exchange is too small to visualize. Reciprocal and nonreciprocal (complete and incomplete) translocations are also referred to as simple translocations. Here, the main indicator on the basis of which the radiation dose is calculated when using the FISH method is their frequency.
Complex translocations, when three or more chromosomes are involved in the exchange, make up a small fraction of the total number of translocations under prolonged sparsely ionizing radiation [16][14]. Difficulties can arise due to counting complex translocations as the sum of simple translocations, whose number is determined by the number of color transitions [17]. Under conditions of densely ionizing radiation, the proportion of complex translocations increases significantly [18][19].
In the publication of the International Atomic Energy Agency, 2011 [1], chromosomal translocations also include insertions in cases when a visible insertion of a region of one chromosome into the arm of a nonhomologous chromosome is observed. The authors note that the frequency of insertions may or may not be taken into account when estimating the radiation dose.
Cytogenetic analysis may also take into account inversions representing intrachromosomal aberrations in which there is a 180° reversal of a chromosome segment. Indication of inversions requires more complex staining — for example, by Multicolor Banding Probes (mBAND) or by combining whole chromosome probes together with telomeric probes. The frequency of inversions is significantly increased by exposure to densely ionizing radiation [18][19].
If several lymphocytes contain identical translocations (the numbers of chromosomes involved in the exchange and the length of the translocated sites are the same), such cells are considered to be clones [1]. In this case, it is assumed that a single translocation occurred in one cell regardless of the number of cells with identical translocations.
Estimation of the frequency of chromosomal translocations for the purposes of retrospective biodosimetry is usually performed in so-called stable cells, i.e., cells that do not contain unstable chromosomal aberrations such as rings and dicentrics that prevent normal cell cycle progression. Unstable cells contain the aberrations mentioned above.
General approaches
The description of dose-effect relationships for translocation frequency are described in detail in the literature along with approaches to parameter determination [1][7][9][13][20]. In our case, the dependences for sparsely ionizing radiation are of interest.
Numerous experiments have demonstrated a linear-quadratic dependence of the frequency of radiation-induced translocations (μi) of lymphocyte radiation dose DL at high dose rates (irradiation time less than 2 hours):
μi = C + α ∙ DL + β ∙ DL2, (1)
where:
С — absolute term of the dose-effect relationship;
α — linear dose-effect coefficient;
β — quadratic coefficient of the dose-effect relationship.
Such a dependence can be explained as follows. It is assumed that the quadratic term β takes into account DNA damage (the source of translocation formation Tr) arising from repeated hits of ionizing particles into the cell nucleus with a short time interval (<2 h). In other words, the coefficient β takes into account aberrations that can be altered by repair mechanisms if they manage to “work” during prolonged exposure or in periods between intermittent (fractionated) acute exposures. Most lesions resulting in chromosomal aberrations are either repaired or become unavailable for repair within about five to six hours after exposure. Therefore, an additional coefficient is proposed for the quadratic term in the form of a G-function [1][21][22], which takes into account the time required for damage repair, i.e., the dose rate:
μi = C + α ∙ DL + β ∙ G(x) ∙ DL2, (2)
G(x) = 2/x2 ∙ [x – 1 + e–x], (3)
in this case, x = t / t0, (4)
where:
t — time (duration) of irradiation,
t0 — average rupture lifetime, which has been shown to be about 2 hours.
When a dose accumulates over a long period of time, G(x) decreases about to zero. Consequently, even if prolonged irradiation occurs with a high dose (>1.0 Gy), the dose dependence of the translocation frequency becomes linear:
μi = C + α ∙ DL. (5)
It is also evident that most aberrations due to the action of sparsely ionizing radiation at low doses (<0.3 Gy) but with high power occur during the passage of single ionizing tracks, resulting in a dependence close to linear.
Thus, a dependence close to linear is observed when there is has been prolonged irradiation (duration of irradiation was days, months, years), including with high accumulated doses (up to 2–3 Gy), or in the case of acute irradiation with low doses when no acute radiation syndrome was detected. Therefore, for retrospective assessment of doses in cases of internal exposure to 89,90Sr, the estimation of the linear coefficient α is of fundamental importance.
As the analysis of experimental data [1] shows, the linear coefficient in formula 5 will be the same both when studying the dose dependence of the translocation frequency and when analyzing the dose dependence of the yield of unstable aberrations (dicentrics, rings). As noted in [23][24], the ratio of dicentrics to radiation-induced translocations is approximately 1:1; as a result, similar ratios in the dose-effect relationship can be expected. According to the dicentrics data, the linear coefficient for translocations for high-energy gamma rays in the case of uniform prolonged irradiation is 0.015–0.020 Tr/GE per Gy [25], which can be used to convert from translocation frequency to dose to lymphocytes. In [26], the recommended value is ~0.015.
Thus, based on (5) and taking into account the background values for the corresponding age (μ0(τs)), the dose to T-lymphocytes is obtained using the formula:
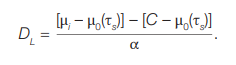 (6)
(6)
Since the absolute term C is mainly due to the background translocation frequency, the expression [С – μ0(τs)] is assumed to be close to zero, so:
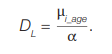 (7)
(7)
Approaches to estimating the coefficients of α are discussed below.
Estimates of the parameter α obtained by acute external gamma irradiation of donor lymphocytes in vitro
Recently, a number of studies have appeared aimed at obtaining calibration curves for translocations estimated by the FISH method under the condition of standardization [1][9][20], which assumes acute irradiation, application of a linear-quadratic model, standard statistical approaches, etc. In order to use the parameters of these dependencies for retrospective dosimetry, translocations must be calculated in stable cells where there are no unstable aberrations interfering with the cell cycle. Since at prolonged irradiation the dose dependence of translocation yield is close to linear, the linear coefficient α should be considered from the obtained parameters of the linear-quadratic dependence for the transition from the translocation frequency to the dose to lymphocytes.
The article [9] gives an overview of the parameters of calibration curves for translocations (determination of coefficients α and β of the linear-quadratic dependence) obtained by FISH following subtraction of background values. As well as being sporadic, such works also differ in their approaches to accounting for translocations (Tr). Table 1 summarizes the results of the most appropriate cytogenetic studies where the α coefficient was statistically significantly determined by in vitro lymphocyte irradiation. In all cases, the authors irradiated donor blood from a 60Co source with a high dose rate; the irradiation time was measured in minutes and the dose-effect was described by a linear-quadratic relationship (formula 1). Table 1 shows that the variation of α values is significant (from 0.012 to 0.0447); the median value is equal to 0.0178 (95% 0.012-0.044) Tr/GE per Gy.
Evaluation of α parameter used in irradiation process in vivo
For in vivo irradiation, the dose to T-lymphocytes and other organs is calculated on the basis of dosimetric measurements. In this case, dose measurements are not made directly in the target cells or tissues, but either by means of a dosimeter located close to the body (in professionals) or by measuring the radionuclide content in the body in the population (measurement of 90Sr content in the bodies of residents of coastal villages of the Techa River), or by reconstructing gamma fields and radiation spectra as in the case of the nuclear bombings of Hiroshima and Nagasaki.
Acute external irradiation of complex spectrum with high power (Hiroshima and Nagasaki populations)
In the cases of atomic bombing, there was an acute single exposure of the population with high dose rate and different LET. Therefore, in order to analyze the dose dependence it is necessary to introduce coefficients that take into account the relative biological effectiveness (RBE) of radiation, which introduces additional uncertainty in dose estimates. In addition, it is known that densely ionizing radiation leads to a large number of complex (compound) damages of DNA and chromosomes [18][19]. This makes it difficult to directly use these data for cases of sparsely ionizing radiation. On the other hand, the cohort of those exposed due to atomic bombardments is the most studied, so the results of cytogenetic studies deserve attention. Dose-dependent analysis of the frequency of stable chromosomal aberrations for the residents of Hiroshima and Nagasaki has been conducted since the 1960s. The results were published as cytogenetic data accumulated and/or as the system for calculating individual doses improved [31–34]. The analysis of cytogenetic data of key interest to us (but using routine Gimza staining of chromosomes) was performed in [34], where reciprocal translocations, pericentric inversions, or small deletions (or their combinations) were considered as stable. Translocations in stable cells — i.e., cells without dicentrics and rings — were counted. The dose-effect relationship was described by a linear-quadratic function (Formula 1). A total of 1703 individuals were included in the study. Individual equivalent doses were calculated with correction for the RBE of neutrons and γ-radiation. The maximum individual doses were 1.5 Sv. The following values of the linear coefficient were obtained:
For Hiroshima inhabitants α = 0.03915 ± 0.00315 Tr to the cell per Zv
μi = (0.01274 ± 0.01399) + (0.03915 ± 0.00315) DL + (0.00970 ± 0.00155) DL2.
For Nagasaki inhabitants α = 0.02350 ± 0.00246 Tr to the cell on Zv
μi = (0.01274 ± 0.11399) + (0.02350 ± 0.00246) DL + (0.01870 ± 0.00099) DL2.
In general, these values are higher than those obtained for the calibration curves (Table 1), but fall within the range of scatter of their values.
The last analysis of the data obtained using FISH and the updated version of the dosimetry system was performed in [35]. Reciprocal and nonreciprocal translocations, insertions (insertions), and complex exchanges were taken into account. The excess relative rate (ERR) of translocation frequency was calculated with correction for background. Although dose-effect parameters for ERR cannot be directly used for quantitative comparison with literature data, the authors noted interesting patterns. Linear-quadratic dependence of translocation frequency (in terms of ERR) on dose was observed up to 1.25 Gy. Thus, the dependence had a more complex character. It was shown that age at the time of irradiation is a significant factor affecting the dose-effect parameters. The lowest values of translocation frequency per 1 Gy were observed in the group of children aged 0–5 years, then the frequency increased to decrease again after 25 years of age.
Prolonged external γ-irradiation with low dose rate (professionals)
The analysis was performed as described in [36]; male workers (n = 459) were included in the study; the dose was up to 1.6 Gy (the accumulated dose was determined on the basis of individual dosimeter data as the dose per RBM). Using the FISH method, simple Tr translocations in stable cells per GE were counted. Data were described by linear regression (Poisson distribution of translocation frequency was tested for each dose group). The AMFIT module of the EPICUR program was used for calculations: α = 0.01174 ± 0.00164.
These values fall within the lower limit of the interval of estimates of the α coefficient from the in vitro calibration curves.
Prolonged external and internal exposure of residents of riverside villages of the Techa River (Southern Urals) with decreasing dose rate
The inhabitants of the riverside villages of the Techa river suffered from radiation expose (mixed γ-, β-irradiation with low dose rates, both external and internal) following discharges of radioactive waste from the Mayak Production Association into the Techa River during the 1950s. External exposure was more pronounced in the upper reaches of the Techa River near to site of radioactive waste discharges. However, throughout the river, the main contribution to the internal dose to the RBM was made by 89,90Sr. Dose-response analysis was performed in 2023 and described in detail [37]. We used pooled data for a long period of studies from 1994 to 2021 (197 donors, 212 blood samples). For each donor, the dose to T-lymphocytes was calculated taking into account age-related dynamics and kinetics of T-cell populations. Simple translocations and complex exchanges in stable cells were taken into account. As in the above-mentioned study [33], the dose dependence of translocation frequency was described by linear regression (Poisson distribution of translocation frequency was checked for each dose group); the AMFIT module of the EPICUR program was used for calculations.
Table 2 shows the values of linear coefficients of α-dose-effect dependence for donors of different ages at the time of the beginning of irradiation in 1950.
The lowest values of translocation frequency per 1 Gy dose to T-lymphocytes were obtained for children of the first years of life (Table 2). The maximum values were observed in the group from 5 to 18 years of age. The data of Table 2 do not contradict the results obtained in vitro (Table 1) and in vivo for professionals [36]. It should be noted that these data are consistent with the results on the evaluation of the effect of age at the time of irradiation on the translocation rate in the Japanese cohort [35], where relatively low values of ERR per 1 Gy were observed in children of the first years of life, followed by an increase in the translocation rate and subsequent decrease in adults after 25 years of age.
To summarize, the in vitro calibration curves described in the literature were obtained by irradiating blood samples with high dose rates (irradiation lasting minutes). Adults aged 25 to 45 years were taken as donors.
The number of donors for the construction of one calibration curve is small (a maximum of 11 people [7], of which sharply falling out values were obtained for two donors, who differed from the rest of the group by almost 10 times. The International Organization for Standardization (ISO) [7] recommends that biodosimetry laboratories develop their own calibration curves to take into account the staining and translocation counting methods adopted by the laboratory and the age range of the subjects. Examples of such work include [20][30].
Although estimates obtained in vivo are based on the study of a large number of donors, the accuracy of dose estimates is much lower. In these studies, parameter values may change with improvements in dosimetric approaches, as is done in the Japanese cohort studies and the Techa River studies.
Table 1. Values of the linear coefficient α (Tr/GE per Gy) of the linear-quadratic dependence of the translocation frequency (with correction of background values) on the lymphocyte dose
|
Coefficient α±SE |
Number of observations, n |
Values, comments |
Source |
|
0.0119±0.0083 CV= 70% |
2 |
Only reciprocal translocations in all cells (stable and unstable) were considered. μi = (0.0014 ± 0.0005) + (0.0119 ± 0.0083)DL + (0.0357 ± 0.0135) DL2 |
[27] |
|
0.0178±0.0037 CV=21% |
5 |
All simple translocations were counted and attributed to all cells (stable and unstable). Complex translocations were converted to an equivalent number of simple translocations. μi = (0.0005 ± 0.0001) + (0.0178 ± 0.0037) DL + (0.0901 ± 0.0054) DL2 |
[9] |
|
0.0152±0.0108 CV=71% |
11 |
All simple translocations in stable cells only were considered. μi = (0.0001 ± 0.0021) + (0.0152 ± 0.0108) DL + (0.0809 ± 0.0061) DL2 |
[28] |
|
0.0447±0.0144 CV=30% |
1 |
All simple translocations were considered and attributed to stable cells only. μi = (0.001 ± 0.0008) + (0.0447 ± 0.0144) DL + (0.0142 ± 0.0195)DL2 |
[29] |
|
0.0343±0.0107 CV=31% |
5 |
All simple translocations were counted and attributed to all cells (stable and unstable). Complex translocations were converted to an equivalent number of simple translocations. No correction was made for background translocations. μi = (0.0040 ± 0.0017) + (0.0343 ± 0.0107) DL + (0.0779 ± 0.0052) DL2 |
[30] |
Table prepared by the authors using data from references [9][27–30]
Note: n is the number of blood donors, adults aged 25 to 45 years.
Table 2. Values of the coefficient α in the linear dependence of the translocation frequency on T-lymphocyte doses, according to Techa River data
|
Age at the beginning of exposure, years |
Number of probes |
Number of translocations on GE per 1 Gy α±SE (95% CI) |
|
0–5 |
58 |
0.0093±0.013 (0.0067–0.0119) |
|
5–18 |
108 |
0.0153±0.0015* (0.0124–0.0183) |
|
18–38 |
46 |
0.0119±0.0029 (0.0063–0.0178) |
Table prepared by the authors using their own data [37]
Note: * — statistically significant differences relative to the 0–5 year’s group.
In the case of uneven internal irradiation, the dose to T lymphocytes is not the same as the dose to other organs and tissues, of which the dose to RBM is of most interest. Coefficient (Borg) can be used to relate the dose to lymphocytes (DL) to the dose on the body (Dorg). Thus, taking into account formula (7), the dose to a particular organ based on cytogenetic data will be calculated according to the formula:
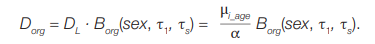 (8)
(8)
If the irradiation occurred decades ago, the donor’s blood contains a mixture of T-lymphocytes, which are descendants of T-cells irradiated at different doses. Two groups of T-lymphocytes can be distinguished, the dose to which differs most significantly in the case of local irradiation of RBM 90Sr.
(1) T-lymphocytes are the descendants of lymphocytes formed (emerged from the thymus) before exposure. Their proportion can be quite significant if the exposure occurred during adolescence and adulthood. Despite the fact that the lifespan of individual lymphocytes is several years (varies in different subpopulations) [38-40], T-lymphocytes are able to proliferate in peripheral lymphoid organs, maintaining quantitative constancy of the peripheral pool of T-cells [41–42] against the background of a sharp age-related decrease in thymus production [39][40][43]. These T-lymphocytes are irradiated only when circulating in the body, spending a certain time, including the bone marrow.
(2) T-lymphocytes, progenitors of progenitors (stem cells) irradiated in the RBM after 90Sr enters the body. The dose load on these cells is much higher than on T-lymphocytes from the first group due to the accumulation of 90Sr in bone tissue to locally irradiate RBM, including T-progenitors. After passing through the stages of differentiation and proliferation in the RBM and in the thymus, the formed T-lymphocytes continue to circulate and in some cases proliferate in the body; their descendants may appear in the donor’s blood sample decades after the beginning of irradiation.
The works [4][6][37][44] describe in detail approaches to modeling the dynamics and biokinetics of T cells based on the concept of T-cell lineage, when the modeling unit is the progenitor and all its progeny (potential carriers of stable aberration). Modeling approaches can be used to determine weighting coefficients for these two groups of T-lymphocytes and estimate the weighted average dose per T-lymphocyte. The evaluations rely on dose calculations to the RBM and other organs and tissues based on dosimetric and biokinetic models for 90Sr [45–46].
The estimation of the conversion factors from dose to T lymphocytes to dose to critical organs (Borg) using 90Sr as an example was described earlier [10]. This factor is the ratio of the corresponding dose coefficients — i.e., the values of the accumulated dose in the case of a single intake of the radionuclide. For a single intake, the following formula is used:
 (9)
(9)
where:
τ1 — the age of the donor at the moment of 90Sr intake (years)
τs — the age of the donor at the time of blood collection for FISH cytogenetic study
Dcorg(sex, τ1, τs) — the dose accumulated in the organ org during the period of time (τs – τ1) after a single intake with food 1 Bq 90Sr; is calculated using dosimetric [45] and biokinetic models [46] that take into account the sex and age of the individual;
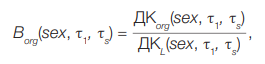
DcL(sex, τ1, τs) — weighted average dose accumulated over a period of time (τs – τ1) in a series of T-cell generations after a single food intake of 1Bq 90Sr; calculated using the model of age dynamics and T-cell kinetics, as well as known values of Dorg doses for organs and tissues in which T-cells spend some time [47]; Gy/Bq. The computer program “Lymphocytes” was used for calculations. Numerical values Dcorg(sex, τ1, τs) for 90Sr are shown in the study [47]. In the case of chronic ingestion, the sum of the dose values from activity ingestion was calculated Ai(t) in every marked period of time. Therefore, for Borg we consider the following:
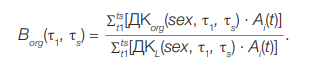 (10)
(10)
Since the values of Ai(t) in the numerator and denominator of formula (10) are reduced in the case of uniform arrival:
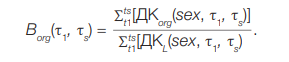 (11)
(11)
However, if the chronic intake was uneven (function Ai(t) is not constant), coefficient Borg must be calculated considering this function.
Numerical values of coefficients Borg, which connect the dose on T-lymphocytes and dose to RBM, were counted and analyzed for 89,90Sr (BSrrbm), [10]. Coefficients BSrrbm turned out to significantly depend on the age at the beginning of 89,90Sr intake. The older a person is at the beginning of exposure, the more the cytogenetic dose differs from the dose to the RBM because the coefficient BSrrbm is growing with age and can and may exceed the value of 5.
This is due to the age-related dynamics of T-cell populations: it is only legitimate to assume that the cytogenetic dose corresponds to the dose to RBM for newborns and children in the first years of life for whom the values of BSrrbm are close to one.
Sex does not have a significant impact on BSrrbm. If homogeneous enrollment was stretched in time by six months, it did not significantly affect the value of the BSrrbm. The study of the effect of the longer intake of 90Sr to BSrrbm (up to 5 years) showed that the most sensitive group is adolescents of 15 years old. For this cohort, the differences of BSrrbm in the case of a single and 5-year even 90Sr intake are about 13%.
In the case of acute whole-body gamma irradiation, the approaches to dose estimation uncertainty are described in detail in [7]. The uncertainties of all input parameters are taken into account: the uncertainty of the translocation frequency estimate, the uncertainty of the calibration curve, and the uncertainty of the age-specific background translocation frequency estimate. These approaches allow estimating the limits of the 95% confidence interval (CI) of the radiation dose to T-lymphocytes, which differs little from the dose to RBM and other organs and tissues. The simplest method [48] is based on estimating the lower and upper limits of CI for the frequency of chromosomal aberrations (in the Poisson distribution approximation) and comparing them with the CI of the calibration curve. In this case, the CI width for the frequency of chromosomal aberrations is chosen to be 83%, which gives 95% CI for the transition to dose uncertainty estimation [49].
More complicated is the method of uncertainty propagation or delta method [1][7], which is based on estimates of the variation (and covariance) of the calibration curve parameters and aberration frequency variance in terms of standard deviation. In this case, the 95% CI of the dose estimate is calculated in the approximation of a normal distribution. This is a conservative method used, for example, for “alien” calibration curves. The need to switch from dose to T-lymphocytes to dose to other organs and tissues is relevant for non-uniform external and internal irradiation.
For the case of non-uniform (partial) external irradiation, scenarios of local irradiation of different segments of the human body containing RBM (e.g., sternum, pelvis, head, etc.) are considered. However, all the proposed statistical methods for estimating the dose accumulated by tissues in the irradiated area (with an estimate of their uncertainty) are based on dicentrics analysis, i.e., they should be applied in a short period of time after exposure [1][50]. The methods are based on the use of the “contaminated” Poisson method, which allows dose estimation to take into account the distribution of dicentrics among all affected cells, as well as providing additional information about the irradiated body volume and RBM. The above methods — in particular, using the Bayesian approach [51] — are implemented in the BiodoseTool, DoseEstimate, and CABAS [50–53] computer programs. However, the applicability of these statistical methods for retrospective dosimetry of internal exposure (using the translocation frequency) is highly questionable, since, as noted above, by the time of blood sampling, different subpopulations of lymphocytes have accumulated different doses depending on the age of the donor at the time of 90Sr intake making it impossible to divide the Poisson distribution into two components.
Under uneven inner irradiation as in the case with 90Sr, the total uncertainty should include — but not be limited to — the uncertainty of factor estimates Borg (Formula 11). Approaches to its assessment currently being developed represent one of the most important directions of our work. It should be noted that individual donor differences in the ability to repair DNA damage (individual differences in the efficiency of repair enzymes) — as well as donor lifestyle, which determines the occurrence of other endogenous and exogenous factors that influence the background frequency of translocations — contribute to the uncertainty of dose estimates.
The total uncertainty determines the threshold of individual doses that can be detected using the FISH method (minimum detectable value). A review by Edwards et al. [26] indicates that supra-phononuclear individual doses of the order of 0.5 Gy can be measured using FISH. In general, reviews on the application of retrospective dosimetry methods note a detectable individual dose value of 0.25–0.3 Gy [54-57] or 0.25–0.4 Gy [3]. In the case of internal 90Sr exposure, this value can be expected to be higher.
For the purposes of retrospective dosimetry, not only individual but also mean group dose estimates using the FISH method are in demand. Such assessments are used in the case of radiation accidents in which large populations are affected or where there is a need to estimate average doses in a locality with a conditionally uniform level of contamination/exposure. In this mean group approach, the total number of translocations detected in all donors in the group is summarized along with the number of background translocations according to the age of each donor in the group. The difference between these numbers considered as radiation-induced translocations refers to the total number of genome-equivalents calculated in the group. Such an approach avoids the null and negative values that often occur when background is subtracted at the individual level at low radiation doses, thus significantly lowering the threshold for detecting dose exceeding the background values. However, the mean group approach requires careful formation of groups with maximally similar exposure conditions. Mean group estimates can also be used to validate individualized dose estimates derived from models and/or other retrospective dosimetry techniques, which include:
The use of cytogenetic data for the purposes of validation of external doses is exemplified in the studies on the Techa River [58][59], where good convergence of the results of estimation of doses to members of epidemiological cohorts estimated on the basis of direct measurements of gamma fields, human body exposure models, data from cytogenetic FISH studies, studies of tooth enamel by the EPR method, etc., was shown.
The used of translocation frequency to provide dose estimates is challenging especially in cases of non-uniform internal irradiation with low dose rates. The conversion factors from chromosomal translocation frequency to T-lymphocyte dose (α) and further from T-lymphocyte dose to organ and tissue dose Borg, which are determined from independent data sets, rely on different approaches.
The α coefficient requires experimental characterization of the calibration curves, since its estimates vary widely, often differing by a factor of two; in addition, values depend on the specific FISH technique used. Calibration curves obtained in vitro for children and adolescents at the time of exposure, whose parameters may differ from those for adults, are not described. No in vitro calibration curves are available for prolonged irradiation at low dose rates. Due to the small number of donors, the curves may involve systematic bias in the dose-effect parameters.
The estimation of the Borg coefficient relies on a set of models, which, in turn, are based on a large amount of experimental data on human physiology, mineral metabolism, anatomical structure of organs, etc. The coefficients depend significantly on age at the time of exposure. Unfortunately, approaches to estimating their uncertainties remain undeveloped to date.
1. Frequency of radiation-induced and background translocations and requirements for their estimation.
2. Transition coefficients from the frequency of radiation-induced translocations to the dose to T lymphocytes (α). General approaches and estimates of transition coefficients based on the construction of in vivoand in vitrocalibration curves under external and internal irradiation were reviewed.
3. Transition factors from T-lymphocyte irradiation dose (cytogenetic dose) to the dose to critical organs and tissues (Borg)
1. IAEA, International Atomic Energy Agency. Cytogenetic dosimetry: applications in preparedness for and response to radiation emergencies. EPR-Biodosimetry. IAEA, Vienna, Austria. 2011.
2. Giussani A, Lopez MA, Romm H, Testa A, Ainsbury EA, Degteva M, et al. Eurados review of retrospective dosimetry techniques for internal exposures to ionising radiation and their applications. Radiat Environ Biophys. 2020;59(3):57–387. https://doi.org/10.1007/s00411-020-00845-y
3. Nakayama R, Abe Y, Goh Swee Ting V, Nakayama R, Takebayashi N, Nakata A, A Riyoshi K et al. Cytogenetic Biodosimetry in Radiation Emergency Medicine: 4. Overview of Cytogenetic Biodosimetry. Radiation Environment and Medicine. 2022;11(2):91–103. https://doi.org/10.51083/radiatenvironmed.11.2_91
4. Tolstykh EI, Degteva MO, Vozilova AV, Anspaugh LR. Local bonemarrow exposure: how to interpret the data on stable chromosome aberrations in circulating lymphocytes? (some comments on the use of FISH method for dose reconstruction for Techa riverside Residents). Radiat Environ Biophys. 2017;56(4):389–403. https://doi.org/10.1007/s00411-017-0712-7
5. Tolstykh EI, Degteva MO, Vozilova AV, Akleyev AV. Interpretation of FISH Results in the Case of Nonuniform Internal Radiation Exposure of Human Body with the Use of Model Approach.
6. Russian Journal of Genetics. 2019;55(10):1227–33 https://doi.org/10.1134/S1022795419100132
7. Tolstykh EI, Vozilova AV, Akleyev AV, Zalyapin VI. Model of agedependent dynamics and biokinetics of T-cells as natural biodosimeters. Radiat Environ Biophys. 2024 Aug;63(3):405–21. https://doi.org/10.1007/s00411-024-01072-5
8. Radiological protection — Performance criteria for laboratories using Fluorescence In Situ Hybridization (FISH) translocation assay for assessment of exposure to ionizing radiation. ISO 20046. 2019.
9. Sigurdson AJ, Ha M, Hauptmann M, Bhatti P, Sram RJ, Beskid O, et al. International study of factors affecting human chromosome translocations. Mutat Res. 2008;652(2):112–21. https://doi.org/10.1016/j.mrgentox.2008.01.005
10. Goh VST, Fujishima Y, Abe Y, Sakai A, Yoshida MA, Ariyoshi K et al. Construction of fluorescence in situ hybridization (FISH) translocation dose-response calibration curve with multiple donor data sets using R, based on ISO 20046:2019 recommendations. Int J Radiat Biol. 2019;95(12):1668–84. https://doi.org/10.1080/09553002.2019.1664788
11. Tolstykh E. I. Conversion from the frequency of chromosome translocations in T-lymphocytes to the bone marrow dose in the long-term period after internal 89,90Sr exposure. Radiation Hygiene. 2024;17(2):53–63 (In Russ). https://doi.org/10.21514/1998-426X-2024-17-2-53-63
12. Tucker JD, Morgan WF, Awa AA, Bauchinger M, Blakey D, Cornforth MN, et al. PAINT: a proposed nomenclature for structural aberrations detected by whole chromosome painting. Mutat Res. 1995 Jun;347(1):21–4. https://doi.org/10.1016/0165-7992(95)90028-4
13. Savage JR, Tucker JD. Nomenclature systems for FISH-painted chromosome aberrations. Mutat Res. 1996 Nov;366(2):153–61. https://doi.org/10.1016/s0165-1110(96)90036-6
14. Stevens-Kroef M, Simons A, Rack K, Hastings RJ. Cyto-genetic Nomenclature and Reporting. Methods Mol Biol. 2017;1541:303–9. https://doi.org/10.1007/978-1-4939-6703-2_24
15. Nugis VYu. FISH-method: technique of cytogenetic retrospective dose evaluation (review). Saratov Journal of Medical Scientific Research.2016;12(4):671–8 (In Russ.). EDN: YPYFKV
16. Fomina J, Darroudi F, Natarajan AT. Accurate detection of true incomplete exchanges in human lymphocytes exposed to neutron radiation using chromosome painting in combination with a telomeric PNA probe. Int J Radiat Biol. 2001;77(12):1175–83. https://doi.org/10.1080/09553000110083951
17. Vozilova AV, Krivoshchapova YV. Investigation of the Frequency of Inversions and Complex Translocations in T-Lymphocytes in Exposed Residents of the Southern Urals. Biology Bulletin. 2023;(50):2979–85. https://doi.org/10.1134/s1062359023110237
18. Pouzoulet F, Roch-Lefèvre S, Giraudet AL, Vaurijoux A, Voisin P, Buard V et al. Monitoring translocations by M-FISH and threecolor FISH painting techniques: a study of two radiotherapy patients. J Radiat Res. 2007;48(5):425–34. https://doi.org/10.1269/jrr.07013
19. Sotnik NV, Azizova TV, Zhuntova GV. Bioindication of internal radiation exposure following accidental radionuclide intake. Extreme Medicine. 2019;21(4):540–7 (In Russ.). EDN: YZWAFI
20. Hada M, Wu H, Cucinotta FA. mBAND analysis for high- and low-LET radiation-induced chromosome aberrations: a review. Mutat Res. 2011;711(1–2):187–92. https://doi.org/10.1016/j.mrfmmm.2010.12.018
21. Nugis VY, Snigiryova GP, Lomonosova EE, Kozlova MG, Nikitina VA. Three-Color FISH Method: Dose-Effect Curves for Translocations in Peripheral Blood Lymphocyte Cultures after Gamma-Irradiation In Vitro. Medical Radiology and radiation safety. 2021;5:12–20 (In Russ.). https://doi.org/10.12737/1024-6177-2020-65-5-12-20
22. Lea DE, Catcheside DG. The mechanism of the induction by radiation of chromosome aberrations in Tradescantia. Journal of Genetics. 1942; 44(2):216–45. https://doi.org/10.1007/BF02982830
23. Bauchinger M, Schmid E, Dresp J. Calculation of the dose-rate dependence of the decentric yield after Co gamma-irradiation of human lymphocytes. Int J Radiat Biol Relat Stud Phys Chem Med. 1979;35(3):229–33. https://doi.org/10.1080/09553007914550261
24. Bauchinger M, Schmid E, Zitzelsberger H, Braselmann H, Nahrstedt U. Radiation-induced chromosome aberrations analysed by two-colour fluorescence in situ hybridization with composite whole chromosome-specific DNA probes and a pancentromeric DNA probe. Int J Radiat Biol. 1993;64(2):79–184. https://doi.org/10.1080/09553009314551271
25. Fernández JL, Campos A, Goyanes V, Losada C, Veiras C, Edwards AA. X-ray biological dosimetry performed by selective painting of human chromosomes 1 and 2. Int J Radiat Biol. 1995;67(3):295–302. https://doi.org/10.1080/09553009514550351
26. Sasaki MS. Advances in the biophysical and molecular bases of radiation cytogenetics. Int J Radiat Biol. 2009;85(1):26–47. https://doi.org/10.1080/09553000802641185 26. Edwards AA, Lindholm C, Darroudi F, Stephan G, Romm H, Barquinero J, et al. Review of translocations detected by FISH for retrospective biological dosimetry applications. Radiat Prot Dosimetry. 2005;113(4):396–402. https://doi.org/10.1093/rpd/nch452
27. Lindholm C, Luomahaara S, Koivistoinen A, Ilus T, Edwards AA, Salomaa S. Comparison of dose-response curves for chromosomal aberrations established by chromosome painting and conventional analysis. Int J Radiat Biol. 1998;74(1):27–34. https://doi.org/10.1080/095530098141690
28. Barquinero JF, Beinke C, Borràs M, Buraczewska I, Darroudi F, Gregoire E, et al. RENEB biodosimetry intercomparison analyzing translocations by FISH. Int J Radiat Biol. 2017;93(1):30–5. https://doi.org/10.1080/09553002.2016.1222092
29. Rodríguez P, Montoro A, Barquinero JF, Caballín MR, Villaescusa I, Barrios L. Analysis of translocations in stable cells and their implications in retrospective biological dosimetry. Radiat Res. 2004;162(1):31–8. https://doi.org/10.1667/rr3198
30. Jeong SK, Oh SJ, Kang YR, Kim H, Kye YU, Lee SH, et al. Biological dosimetry dose-response curves for residents living near nuclear power plants in South Korea. Sci Prog. 2023;106(3):368504231198935. https://doi.org/10.1177/00368504231198935
31. Sposto R, Stram DO, Awa AA. An estimate of the magnitude of random errors in the DS86 dosimetry from data on chromosome aberrations and severe epilation. Radiat Res. 1991;128(2):157–69. PMID: 1947012
32. Stram DO, Sposto R, Preston D, Abrahamson S, Honda T, Awa AA. Stable chromosome aberrations among A-bomb survivors: an update. Radiat Res. 1993;136(1):29–36. PMID: 8210335
33. Awa A. Analysis of chromosome aberrations in atomic bomb survivors for dose assessment: studies at the Radiation Effects Research Foundation from 1968 to 1993. Stem Cells. 1997;15 Suppl 2:163–73.https://doi.org/10.1002/stem.5530150724
34. Sasaki MS, Endo S, Ejima Y, et al. Effective dose of A-bomb radiation in Hiroshima and Nagasaki as assessed by chromosomal effectiveness of spectrum energy photons and neutrons. Radiat Environ Biophys. 2006;45(2):79–91. https://doi.org/10.1007/s00411-006-0051-6
35. Sasaki MS, Endo S, Ejima Y, Saito I, Okamura K, Oka Y, et al. The Association of Radiation Exposure with Stable Chromosome Aberrations in Atomic Bomb Survivors Based on DS02R1 Dosimetry and FISH Methods. Radiat Res. 2023;199(2):170–81. https://doi.org/10.1667/RADE-22-00154.1
36. Tawn EJ, Curwen GB, Jonas P, Gillies M, Hodgson L, Cadwell KK. Chromosome Aberrations Determined by FISH in Radiation Workers from the Sellafield Nuclear Facility. Radiat Res. 2015;184(3):296–303.https://doi.org/10.1667/RR14125.1
37. Tolstykh EI, Vozilova AV, Degteva MO, et al. Dependence of the Translocation Frequency in Blood Lymphocytes on the Dose and Age at the Onset of Exposure in Residents of the Techa Riverside Settlements. Radiacionnaya biologiya. Radioekologiya. 2023;63(2):3184–95 (In Russ.). https://doi.org/10.31857/S086980312302011X
38. Vrisekoop N, den Braber I, de Boer AB, Ruiter AF, Ackermans MT, van der Crabben SN, et al. Sparse production but preferential incorporation of recently produced naive T cells in the human peripheral pool. Proc Natl Acad Sci USA. 2008;105(16):6115–20. https://doi.org/10.1073/pnas.0709713105
39. De Boer RJ, Perelson AS. Quantifcation T lymphocyte turnover. J Theor Biol. 2013;(327):45–87. https://doi.org/10.1016/j.jtbi.2012.12.025
40. De Boer RJ, Tesselaar K, Borghans JAM. Better safe than sorry: Naive T-cell dynamics in healthy ageing. Semin Immunol. 2023;70:101839. https://doi.org/10.1016/j.smim.2023.101839
41. Yan J, Greer JM, Hull R, O’Sullivan JD, Henderson RD, Read SJ, et al. The effect of ageing on human lymphocyte subsets: comparison of males and females. Immun Ageing. 2010;7:4. https://doi.org/10.1186/1742-4933-7-4
42. Den Braber I, Mugwagwa T, Vrisekoop N, Westera L, Mögling R, de Boer AB, et al. Maintenance of peripheral naive T cells is sustained by thymus output in mice but not humans. Immunity. 2012;36(2):288–97 https://doi.org/10.1016/j.immuni.2012.02.006
43. Steinmann GG, Klaus B, Muller-Hermelink HK. The involution of the ageing human thymic epithelium is independent of puberty. A morphometric study. Scand J Immunol. 1985;(22):563–75. https://doi.org/10.1111/j.1365–3083.1985.tb01916.x
44. Tolstykh EI, Vozilova AV, Degteva MO, et al. Concept of T-cell genus as the basis for the analysis of FISH results after local bone marrow exposure. Biology Bulletin. 2020;47(11):1495– 506. https://doi.org/10.1134/S1062359020110151
45. Degteva MO, Tolstykh EI, Shishkina EA, Sharagin PA, Zalyapin VI, Volchkova AY, et al. Stochastic parametric skeletal dosimetry model for humans: General approach and application to active marrow exposure from bone-seeking beta-particle emitters. PLoS One. 2021;16(10):e0257605. https://doi.org/10.1371/journal.pone.0257605
46. Shagina NB, Tolstykh EI, Degteva MO, Anspaugh LR, Napier BA. Age and gender specific biokinetic model for strontium in humans. J Radiol Prot. 2015;35(1):87–127. https://doi.org/10.1088/0952-4746/35/1/87
47. Tolstykh EI, Degteva MO. Estimation of radiation doses on lymphocytes and their progenitors after ingestion of strontium-89,90. Radiation Hygiene. 2022;15(3):82–91 (In Russ.). https://doi.org/10.21514/1998-426X-2022-15-3-82-91
48. Merkle W. Statistical methods in regression and calibration analysis of chromosome aberration data. Radiat Environ Biophys. 1983;21(3):217–33.
49. Austin PC, Hux JE. A brief note on overlapping confidence intervals. J Vasc Surg. 2002;36(1):194–5. https://doi.org/10.1067/mva.2002.125015
50. Hernández A, Endesfelder D, Einbeck J, Puig P, Benadjaoud MA, Higueras M, et al. Biodose Tools: An R Shiny Application for Biological Dosimetry. 2023;99(9):1378–90. https://doi.org/10.1080/09553002.2023.2176564
51. Higueras M, Puig P, Ainsbury EA, Vinnikov VA, Rothkamm K. A new Bayesian model applied to cytogenetic partial body irradiation estimation. Radiat Prot Dosimetry. 2016;168(3):330–6. https://doi.org/10.1093/rpd/ncv356
52. Ainsbury EA, Lloyd DC: Dose estimation software for radiation biodosimetry. Health Phys. 2010;98(2):290–5. https://doi.org/10.1097/01.HP.0000346305.84577.b4
53. Deperas J, Szluinska M, Deperas-Kaminska M, Edwards A, Lloyd D, Lindholm C, et al. CABAS: a freely available PC program for fitting calibration curves in chromosome aberration dosimetry. Radiat Prot Dosimetry. 2007;124(2):115–23. https://doi.org/10.1093/rpd/ncm137
54. Gnanasekaran TS. Cytogenetic biological dosimetry assays: recent developments and updates. Radiat Oncol J. 2021;39(3):159–66. https://doi.org/10.3857/roj.2021.00339
55. Beinke C, Siebenwirth C, Abend M, Port M. Contribution of Biological and EPR Dosimetry to the Medical Management Support of Acute Radiation Health Effects. Appl Magn Reson. 2022;(53):265–87. https://doi.org/10.1007/s00723-021-01457-5
56. M’Kacher R, Colicchio B, Junker S, El Maalouf E, Heidingsfelder L, Plesch A, et al. High Resolution and Automatable Cytogenetic Biodosimetry Using In Situ Telomere and Centromere Hybridization for the Accurate Detection of DNA Damage: An Overview. Int J Mol Sci. 2023;24(6):5699. https://doi.org/10.3390/ijms24065699
57. Herate C, Sabatier L. Retrospective biodosimetry techniques: Focus on cytogenetics assays for individuals exposed to ionizing radiation. Mutat Res Rev Mutat Res. 2020;(783):108287. https://doi.org/10.1016/j.mrrev.2019.108287
58. Degteva MO, Shagina NB, Shishkina EA, Vozilova AV, Volchkova AY, Vorobiova MI, et al. Analysis of EPR and FISH studies of radiation doses in persons who lived in the upper reaches of the Techa River. Radiat Environ Biophys. 2015;54(4):433–44. https://doi.org/10.1007/s00411-015-0611-8
59. Degteva MO, Shishkina EA, Tolstykh EI, et al. Application of the EPR and FISH Methods to Dose Reconstruction for People Exposed in the Techa River Area. Radiats Biol Radioecol. 2017;57(1):30–41. English, Russian. https://doi.org/10.7868/S0869803117010052
Chelyabinsk
Chelyabinsk
Chelyabinsk
Chelyabinsk
Chelyabinsk
Tolstykh E.I., Akhmadullina Y.R., Sharagin P.A., Shishkina E.A., Akleyev A.V. Retrospective biodosimetry: Conversion of frequency of chromosomal translocations into organ doses. Extreme Medicine. 2024;26(3):5-14. https://doi.org/10.47183/mes.2024-26-3-5-14
10 bld. 1 Pogodinskaya Str., Moscow, Russia 119121
tel.: +7 (495) 540-61-71, ext.: 4190, 4191, 4192
E-mail: Extrememedicine@cspfmba.ru
Processing of personal data