


Contents
Scroll to:
 V. V. Abzianidze,
N. V. Skvortsov,
G. V. Karakashev,
P. P. Beltyukov,
D. S. Suponina,
V. O. Musatova,
A. S. Bogachenkov,
D. V. Krivorotov
V. V. Abzianidze,
N. V. Skvortsov,
G. V. Karakashev,
P. P. Beltyukov,
D. S. Suponina,
V. O. Musatova,
A. S. Bogachenkov,
D. V. Krivorotov https://doi.org/10.47183/mes.2025-303
Scroll to:
Introduction. The determination of metabolism and pharmacokinetics is an essential requirement in the development of any drug. Phaeosphaeride A (PPA) is an anticancer agent belonging to the group of natural compounds with antitumor properties, which was first isolated from the endophytic fungus FA39 by Harvard scientists (Claudy et al.) in 2006. In this study, we investigate compound AV6, which is a derivative of natural phaeosphaeride A.
Objective. To study the acute toxicity and pharmacokinetic characteristics of the semi-synthetic substance AV6 obtained based on phaeosphaeride A, a natural phytotoxin with antitumor properties, following a single intragastric administration of AV6 in laboratory rodents.
Materials and methods. The acute toxicity of AV6 was studied using 30 male Balb/c mice, which were divided into five groups of six animals each. The control group received a single intragastric administration of a solvent (oil-alcohol emulsion, 300 µL volume), while four experimental groups received AV6 at doses of 5, 50, 300, and 2000 mg/kg bw. Body weight dynamics were evaluated, and organ mass coefficients were calculated. The pharmacokinetic study was performed following a single intragastric administration of AV6 at a dose of 25 mg/kg bw to outbred male Wistar rats. The AV6 dose for the pharmacokinetic study was determined based on acute toxicity data, accounting for the interspecies conversion factor. Quantitative determination of AV6 in blood plasma and urine was performed using the MS/MS method. Statistical analysis was conducted using GraphPad Prism 5 software.
Results. According to the acute toxicity data following intragastric administration, the AV6 phaeosphaeride A derivative can be classified as hazard class 3 (animal mortality was observed exclusively in the 2000 mg/kg bw group). Visual examination of internal organs revealed no apparent macroscopic signs of pathology. No statistically significant changes in the mass coefficients of internal organs were detected in experimental animals compared to controls. A quantitative determination procedure for AV6 was developed based on HPLC–MS/MS analysis. Metabolites formed in rats in vivo were identified. A comparison of rat blood plasma chromatograms 1 h and 10 h after intragastric AV6 administration showed that, after 1 h, the AV6 peak intensity was 20 times higher than the M2 peak. However, after 10 h, the AV6 peak intensity decreased, while the metabolite M2 peak intensity increased.
Conclusion. Compound AV6 is classified as a moderately hazardous substance. Data on the structure of AV6 metabolites (a derivative of natural phaeosphaeride A) obtained during pharmacokinetic studies in rats indicate a relatively low metabolic rate of the compound. This is primarily due to chemical transformations at the nitrogen atom of the lactam ring, resulting in metabolites that may be excreted in urine. The most probable mechanisms of these transformations are oxidative deacylation followed by hydrolysis. The completed preclinical study evaluating the acute toxicity, metabolism, and pharmacokinetics of AV6 represents a crucial step in translating previous findings on the antitumor potential of this derivative of natural phaeosphaeride A and advancing in vivo research.
Abzianidze V.V., Skvortsov N.V., Karakashev G.V., Beltyukov P.P., Suponina D.S., Musatova V.O., Bogachenkov A.S., Krivorotov D.V. Evaluation of acute toxicity and pharmacokinetics of a natural phaeosphaeride A derivative in laboratory rodents. Extreme Medicine. 2025;27(4):441-452. https://doi.org/10.47183/mes.2025-303
Cancer, along with cardiovascular diseases, continues to be a leading cause of mortality worldwide. According to WHO projections, cancer incidence will increase by 70% over the next 20 years, becoming the cause of nearly one in six deaths globally [1].
For the past 50 years, chemotherapy has remained the primary treatment for cancer, despite its serious side effects. Among them are multidrug resistance, hepatotoxicity (which was until recently considered an inevitable consequence of chemotherapy), and other significant adverse effects1 [2]. The underlying causes of multiple adverse drug reactions fall within the research domains of molecular biology, cytology, genetics, and related disciplines.
The development prospects of any anticancer drug depend on understanding its molecular mechanisms of action, specific tumor-targeting effects and influence on the tumor microenvironment, pharmacokinetic properties, toxicity and safety profile, as well as other critical factors.
Achievement of therapeutic in vivo concentrations sufficient for full clinical efficacy represents a major challenge in anticancer drug development2. Essential data for drug development must also include information on the systemic effects of potential anticancer compounds in animal models used for toxicological evaluation of drug prototypes, enabling dose extrapolation to humans3.
Preclinical drug development requires comprehensive pharmacokinetic studies in animal models to evaluate optimal efficacy and safety profiles. Historically, such studies primarily utilized radiolabeled compounds. Over the past two decades, analytical approaches based on tandem mass spectrometry (MS/MS) have become widely adopted, proving effective for both clinical therapeutic drug monitoring and preclinical development of novel pharmaceuticals [3].
In our previous research, we investigated AV6, a derivative of natural phaeosphaeride A [4] with the chemical structure (2S,3R,4R)-3-hydroxy-6-methoxy-3-methyl-7-methylene-2-pentyl-4-pyrrolidin-1-yl-3,4,6,7-tetrahydropyrano[ 2,3-c]pyrrol-5(2H)-one [5-10], and established its:
These dual properties — intrinsic antitumor activity and ability to reduce MDR1 substrate efflux — render AV6 a promising lead compound for anticancer drug development.
In this study, we aim to investigate the acute toxicity and pharmacokinetic properties of semi-synthetic AV6, based on the natural phytotoxin phaeosphaeride A with established antitumor activity, following single intragastric administration in laboratory rodents.
The study was conducted in compliance with the requirements of Federal Law No. 61-FZ dated 12.04.2010 (Russian Federation)4, the national standard GOST R 53434-20095, Good Laboratory Practice (GLP) principles6, Guidelines on preclinical research7. The requirements for the housing and care of animals used for scientific purposes comply with Directive 2010/63/EU8.
The acute toxicity of AV6 was evaluated in male Balb/c mice (8–10 weeks old, body weight 17.5–19.5 g) obtained from the Rappolovo Laboratory Animal Breeding Facility.
The acute toxicity study of AV6 in mice was performed to establish those dose levels that do not cause acute intoxication or animal death following single intragastric administration of an oil-alcohol emulsion of the substance. The selection of this administration form for AV6 was based on the need to obtain a homogeneous mixture and to enhance the bioavailability of the hydrophobic AV6 compound, since dilution of initial AV6 solutions in other solvents followed by water dilution resulted in immediate precipitation.
Experiments on acute toxicity evaluation via intragastric administration with determination of the test substance hazard class were conducted in accordance with GOST 32644-2014, identical to the international document OECD Test Guideline No. 423:2001 (Acute Oral Toxicity — Acute Toxic Class Method, IDT).
The AV6 emulsion for intragastric administration was prepared by dissolving a weighed portion of the substance in a minimal volume of ethanol (10–72 μL, depending on the required amount of AV6) followed by addition of an oil-alcohol mixture such that the administration volume always amounted to 300 μL. The final concentration of AV6 in the emulsion depended on the animal’s body weight and the dose used in the experiment, with ethanol concentration in the preparation being ~23%. The addition of oil to the alcohol solution of AV6 allowed a homogeneous mixture to be obtained, thus ensuring uniform dosing conditions for the study purposes. Food was withdrawn 2 h before drug administration and access to food was restored 2 h after administration. Intragastric administration was performed using a mouse gastric tube and syringe.
All treated animals (30 males) were divided into five groups of six animals each. The control group received intragastric administration of the solvent (oil-alcohol emulsion in a volume of 300 μL), while four groups (experimental animals) received AV6 at doses of 5, 50, 300, and 2000 mg/kg bw.
Observation of the animals was carried out for the first 30 min after dose administration, then periodically during the first 24 h and daily for a total of 14 days to record any clinical signs of toxicity or mortality. The body weight of the animals was measured one day after administration and at the end of each week of observation. Upon completion of the experiment after 14 days, the general toxic effect of AV6 was evaluated. For this purpose, blood samples were collected from all surviving animals, which were then subjected to cervical dislocation, and internal organs — the heart, lungs, liver, kidneys, spleen, and thymus — were extracted to assess their appearance and determine their weights for calculating organ-to-body weight ratios (the ratio was calculated as organ weight (g)/body weight (g) × 100).
The pharmacokinetic evaluation of AV6 was conducted on five outbred male Wistar rats weighing 350–380 g from the Rappolovo Laboratory Animal Breeding Facility.
All animals underwent quarantine and acclimatization to the animal facility conditions before the onset of the experiment. The rodents were housed in groups of five per cage with free access to food and water. A complete granulated feed “CHARA” for laboratory rodents was used as the diet. The animal facilities maintained a day/night cycle (12 h/12 h), a temperature of 20–26°C, and humidity of 30–70%.
Catheterization of the jugular vein in rats used in pharmacokinetic studies was performed under inhalation anesthesia with a gas mixture (5% isoflurane in air) using an Univentor 410 Anaesthesia Unit (Univentor Ltd, Malta).
The animals were placed in a supine position, and their front and hind limbs were secured with adhesive tape to the surface of a heated and illuminated surgical table. After achieving surgical access to the v. jugularis externa and placing a cranial ligature around the vessel, catheterization was performed. The catheter was inserted into the vein toward the heart until the catheter ring reached the vessel incision site. In this position, the catheter tip was sufficiently close to the entrance of the right atrium.
The catheter was then secured in the vessel using the remaining ends of the previously placed cranial ligature. After fixation, the catheter was tunneled subcutaneously to the scruff of the neck and then exteriorized dorsally between the scapulae through a small incision (~1 cm). Following wound closure, a harness was placed on the animal, through which the free end of the catheter was routed for connection to an Accusampler automatic blood sampling device.
Under these conditions, the rat was housed in a specialized cage with minimal movement restrictions. Throughout the post-catheterization period, the catheter was automatically flushed every 30 min with heparinized saline (16 IU/mL) in a volume of 20 µL.
Before initiating pharmacokinetic studies, at least 36 h were allowed after surgery to ensure animal recovery and minimize the influence of surgical trauma and anesthetic agents on the absorption, metabolism, and elimination of the test compound.
Pharmacokinetic studies
The pharmacokinetic studies were conducted following a single intragastric administration of a guaranteed safe dose of AV6 (25 mg/kg bw) in an oil-alcohol emulsion, which was selected based on the results of acute toxicity studies in mice, taking into account known interspecies conversion factors for rats.
Prior to drug administration, baseline blood samples of 0.2 mL were collected from all rats. The Accusampler system used for in vivo blood sampling ensured periodic flushing of the device’s capillaries and valves with heparinized saline (16 IU/mL) and allowed for the collection of whole blood in predetermined 200 µL volumes without dilution. After each blood sample collection, the volume was automatically replaced with heparinized saline. Automated blood sampling was performed at 20, 30 min, 1, 2, 4, 6, 8, 24, and 48 h. The sample tubes were centrifuged (5 min, 11,000 rpm) at room temperature. The supernatant (approximately 100 µL) was transferred using a mechanical pipette into Eppendorf tubes, frozen, and stored for subsequent analysis at minus 80°C for no more than two months.
Urine samples (0.3–0.5 mL) were collected at intervals before drug administration, as well as at 8, 24, and 48 h after administration. The collected samples were centrifuged (3 min, 14,000 rpm) to remove insoluble precipitates. The supernatant was transferred using a mechanical pipette into Eppendorf tubes, frozen, and stored at minus 80°C for no more than 2 months. Centrifugation was performed using a Hermle Z160M centrifuge with an angular rotor (rotor radius — 8.5 cm).
In the study of the pharmacokinetic characteristics of AV6 and its potential metabolites, the following parameters were determined: elimination rate constant (ke), half-life (T½), area under the pharmacokinetic curve (AUC0→48), volume of distribution (Vd), and total clearance during the elimination phase (CLtot).
Sample preparation of urine and blood plasma for AV6 and metabolites determination
In 2.0 mL Eppendorf tubes, 0.05 mL of the analyzed sample (blood plasma or urine) was added, followed by 0.15 mL of acetonitrile. The mixture was thoroughly vortexed (BioSan FVL-2400n) and centrifuged for 3 min at 14,000 rpm. The supernatant was transferred into a 0.2 mL insert chromatographic vial. The vials were placed into the chromatograph autosampler, with an injection volume of 0.005 mL.
Quantification of AV6 and its metabolites was performed using an UltiMate 3000 liquid chromatograph equipped with an autosampler and a Q-Exactive mass-selective detector with electrospray ionization at atmospheric pressure. Data acquisition and processing were performed using the Xcalibur software.
For quantitative determination and precise confirmation of the presence of AV6 in blood plasma or urine, an MS/MS method was employed. The confirmation of AV6/metabolites in complex matrices (blood plasma or urine) was based on the detection of three product ions characteristic of the analyzed substance. Given the preliminary nature of the study, which primarily aimed to identify AV6 and potential metabolites, the complete validation method for quantitative determination was not conducted. The AV6 reference material used for calibration samples was preliminarily analyzed by NMR (Bruker AVANCE III 400 MHz NMR spectrometer); the purity of at least 99% was confirmed.
For calibration sample preparation, 0.495 mL of blood plasma or urine and 0.005 mL of AV6 solution (1 mg/mL in methanol) were dispensed into a 2.0 mL Eppendorf tube. The resulting blood plasma or urine samples contained AV6 at a concentration of 10 μg/mL. Serial dilutions (by adding 0.05 mL of the prepared AV6 solution to 0.45 mL of blood plasma or urine) yielded solutions with AV6 concentrations of 1, 0.1, and 0.01 μg/mL.
For analysis, 0.05 mL of each calibration sample (blood plasma or urine) was dispensed into a 2.0 mL Eppendorf tube, followed by 0.15 mL of acetonitrile. The mixture was thoroughly vortexed and centrifuged (3 min, 14,000 rpm). The supernatant was transferred into a 0.2 mL insert chromatographic vial, which was then placed into the chromatograph autosampler. The injection volume was 0.005 mL.
Chromatographic separation conditions
Column Specifications: column Zorbax SB-C8 (Agilent), length 150 mm, internal diameter 4.6 mm, sorbent particle size 1.8 μm. Mobile Phase Composition:
Chromatographic Elution Mode: Gradient elution. Mobile phase component ratios are shown in Table 1.
The study was conducted with the following chromatographic parameters: a flow rate of 0.4 mL/min, a column oven temperature of 35°C, an injection volume of 5.0 μL, the total run time of 14 min.
Mass spectrometric detection parameters
The study was performed under the following operating conditions of the Q-Exactive mass spectrometric detector with electrospray ionization at atmospheric pressure: drying gas flow — 45 arbitrary units; auxiliary gas flow — 20 arbitrary units; sprayer pressure — 35 psi; drying gas temperature — 350°C; auxiliary gas stream temperature — 400°C; capillary voltage — 3500 V. Detection was carried out in full ion current scanning mode (SCAN), with ion registration in the m/z range 60–900 amu throughout the entire analysis (under positive ionization).
Ionization source mode: electrospray ionization at atmospheric pressure.
Detection mode: detection under positive ionization in MS and MS/MS modes at high resolution.
Detected ion polarity: detection of positive ions.
Scanning mode: detected mass range, m/z 60–950 amu, collision cell voltage — 25 arbitrary units.
The high-resolution mass spectrometry (HRMS) mode was used to acquire mass chromatograms based on the exact masses of the molecular ions of the compounds listed above. Statistical analysis was performed using the GraphPad Prism 5 software.
Acute toxicity of AV6 upon intragastric administration
During the experiment, animal mortality was observed exclusively in the 2000 mg/kg bw group (three mice (50%) died on the second day after AV6 administration). On this basis, the studied phaeosphaeride A derivative (AV6) can be classified as hazard class 3, since the LD50 value for AV6 in the form of an oil-alcohol emulsion upon intragastric administration, according to the obtained data, is close to the maximum tested dose of 2000 mg/kg bw.
Measurements of animal body weight in the experimental groups showed its low dependence on the effects of AV6 upon intragastric administration. The results of mouse body weight measurements and organ-to-body weight ratios are presented in Tables 3 and 4.
Visual examination of internal organs revealed no apparent macroscopic pathological alterations. Furthermore, the comparative analysis demonstrated no statistically significant differences in organ-to-body weight ratios between experimental and control animal groups.
Pharmacokinetic study of AV6 and identification of its metabolites
The pharmacokinetics of AV6 and identification of its potential metabolites were investigated following single intragastric administration of AV6 (25 mg/kg bw). The concentration-time data for AV6 were analyzed using a non-compartmental approach.
The absorption pharmacokinetics of AV6 after intragastric administration was characterized by a relatively rapid achievement of maximum concentration (30 ng/mL), with Tmax ranging 30–60 min. The formal conversion based on rat blood volume (58–64 mL/kg bw) [11, 12] suggests that approximately 10–15% of the intragastrically administered AV6 dose was absorbed into the systemic circulation of experimental rats.
The elimination phase of AV6 concentration showed exponential decay. The elimination rate constant (ke) was determined from the slope of the concentration–time curve in semi-logarithmic coordinates using data from five animals.
The area under the concentration–time curve (AUC) was calculated using blood concentration data from 20 min to 48 h post-administration, applying the trapezoidal rule. The volume of distribution (Vd) was estimated considering the assumed oral bioavailability (approximately 15%) of AV6. The pharmacokinetic parameters following intragastric administration of AV6 are presented in Table 5.
The exponential approximation generally provides adequate description of AV6 concentration–time curves during the elimination phase. However, certain experiments demonstrated an increase in plasma concentration within 2–5 h post-administration. This kinetic pattern most likely reflects substance redistribution from circulation into hydrophobic compartments (intercellular spaces) with subsequent re-entry into systemic circulation. Potential plasma protein binding effects on AV6 extraction from biological samples should also be considered.
The elimination phase shows rapid AV6 concentration decline, as evidenced by the determined ke and T½ values. This kinetic behavior presumably results from metabolic transformation of the compound, supported by detection of significant M2 metabolite levels in plasma 10 h post-dosing.
Urinary excretion assessment of AV6 and its metabolites was based on concentration measurements in urine samples collected at intervals over 48 h following intragastric administration. Cumulative 24-h excretion (normalized to approximate daily urine volume of ~12 mL) ranged 750–1400 ng, representing 50–93% of systemically absorbed drug (assuming 15% oral bioavailability).
At this stage of the study, data on two major metabolites were obtained. Figures 2–4 present chromatograms of blood plasma samples from experimental animals. In addition to the parent compound, the samples demonstrated the presence of its metabolites M1 and M2.
The analysis of rat plasma chromatograms revealed the appearance of novel compounds and corresponding chromatographic peaks in samples collected 1 h post-administration (Fig. 3), which were identified as metabolites of AV6. Their structural characteristics are presented in Table 6.
The plasma chromatograms clearly demonstrate the presence of intact AV6 (Fig. 3a), along with trace amounts of metabolite M1 (Fig. 3b) and metabolite M2 (Fig. 3c). The retention times (RT) were determined to be 7.68 min for AV6 and 6.53 min for metabolite M2.
The chromatographic comparison of rat plasma samples collected 1 h (Fig. 3) and 10 h (Fig. 4) after intragastric AV6 administration demonstrates significant kinetic changes. At the 1-h timepoint, the peak intensity of AV6 exceeded that of metabolite M2 by 20-fold. By 10 h post-administration, the intensity of the AV6 peak had decreased substantially, while the M2 metabolite peak showed marked intensification.
The obtained chromatographic data confirm the consistent detection of metabolite M2 throughout the 1–10 h period following AV6 administration. Notably, the relative abundance of M2 surpassed that of the parent compound by the 10-h observation point. This kinetic profile suggests a greater metabolic stability of M2 compared to AV6. Furthermore, the pharmacological effects originally attributed to AV6 may potentially be mediated by M2 activity. Metabolite M1 was not detected in plasma samples at either
timepoint.
Results of AV6 and its metabolites quantification in urine samples
The mass chromatograms of urine samples collected before AV6 administration (Fig. 5), 8 h post-administration (Fig. 6), and 24 h post-administration (Fig. 7) demonstrate the following metabolic profile:
No target compounds (AV6 or its metabolites M1/M2) were detected in blank (pre-dose) samples.
Table 1. Mobile phase composition gradient profile
|
Time, min |
Component, % |
|
|
А |
В |
|
|
0.00 |
60 |
40 |
|
0.50 |
60 |
40 |
|
7.00 |
10 |
90 |
|
10.00 |
10 |
90 |
|
10.10 |
60 |
40 |
|
14.00 |
60 |
40 |
Table prepared by the authors using their own data
Table 2. Fragmentation conditions for AV6
|
Mass [m/z] |
Formula [M] |
Species |
Polarity |
(N)CE |
(N)CE type |
Comment |
|
351,22783 |
C19H30N2O4 |
+ H |
Positive |
25 |
NCE |
AV-6 |
Table prepared by the authors using their own data
Table 3. Results of animal body weight assessment (g)
|
Observation period |
Animal groups |
||||
|
Control n = 6 |
5 mg/kg n = 6 |
50 mg/kg n = 6 |
300 mg/kg n = 6 |
2000 mg/kg* |
|
|
Day 1 |
18.7 ± 0.7 |
20.0 ± 0.3 |
18.1 ± 0.6 |
19.0 ± 0.7 |
18.3 ± 0.7 |
|
Week 1 |
18.9 ± 0.8 |
20.1 ± 0.1 |
19.3 ± 0.4 |
19.4 ± 0.9 |
18.4 ± 1.6 |
|
Week 2 |
19.2 ± 0.8 |
20.4 ± 0.4 |
19.0 ± 0.5 |
19.6 ± 1.0 |
19.1 ± 1.4 |
Table prepared by the authors using their own data
Note: * — the presented data are for surviving animals only (n = 3); the data are presented as mean ± standard error of the mean (M ± m).
Table 4. Organ-to-body weight ratios (relative organ weights)
|
Organ |
Animal groups |
||||
|
Control n = 6 |
5 mg/kg n = 6 |
50 mg/kg n = 6 |
300 mg/kg n = 6 |
2000 mg/kg n = 3 |
|
|
Heart |
0.54 ± 0.06 |
0.50 ± 0.03 |
0.57 ± 0.06 |
0.53 ± 0.08 |
0.58 ± 0.04 |
|
Liver |
5.16 ± 0.33 |
5.05 ± 0.30 |
4.86 ± 0.16 |
4.86 ± 0.36 |
5.57 ± 0.15 |
|
Kidneys |
0.71 ± 0.07 |
0.70 ± 0.04 |
0.66 ± 0.05 |
0.68 ± 0.05 |
0.76 ± 0.07 |
|
Spleen |
0.53 ± 0.10 |
0.59 ± 0.12 |
0.49 ± 0.03 |
0.47 ± 0.03 |
0.54 ± 0.20 |
|
Lungs |
1.12 ± 0.32 |
0.88 ± 0.10 |
1.00 ± 0.13 |
0.91 ± 0.15 |
1.10 ± 0.25 |
|
Thymus |
0.25 ± 0.06 |
0.24 ± 0.09 |
0.25 ± 0.07 |
0.23 ± 0.06 |
0.32 ± 0.06 |
Table prepared by the authors using their own data
Note: the data are presented as mean ± standard error of the mean (M ± m).
Table 5. Pharmacokinetic parameters in rats following single intragastric administration of AV6
at 25 mg/kg bw
|
Parameter |
Parameter Value |
|
Elimination rate constant (ke), h–1 |
0.138–0.219 |
|
Half-life (Т½), h |
3.2–5.0 |
|
Area under the (pharmacokinetic) concentration-time curve (AUC0→48), µg×h/L |
80–98 |
|
Volume of distribution (Vd), L |
~50 |
|
Total clearance during elimination phase (CLtot), mL/min |
~165 |
Table prepared by the authors using their own data
Table 6. Molecular ion peaks of AV6 and its metabolites (М1 и М2)
|
Code |
Gross formula |
Molecular weight |
m/z [M + H]+ |
Structural formula |
Retention time RT, min |
|
AV-6 |
C19H30N2O4 |
350.22056 |
351.22783 |
7.68 |
|
|
М1 |
C18H28N2O4 |
336.20491 |
337.21218 |
7.11 |
|
|
М2 |
C18H28N2O3 |
320.20999 |
321.21727 |
6.53 |
Table prepared by the authors using their own data
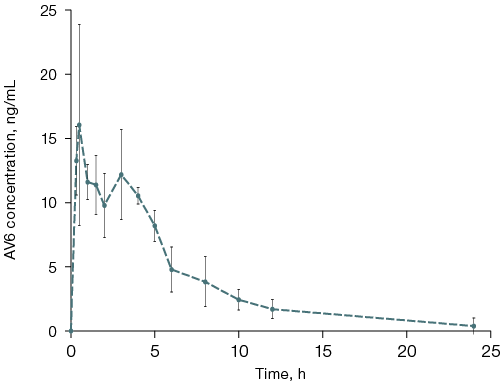
Figure prepared by the authors using their own data
Fig. 1. Plasma concentration-time profile of AV6 in rats following single intragastric administration
Note: the graph was generated using the GraphPad Prism 5 software; the data are presented as mean ± standard error of the mean (M ± δ).
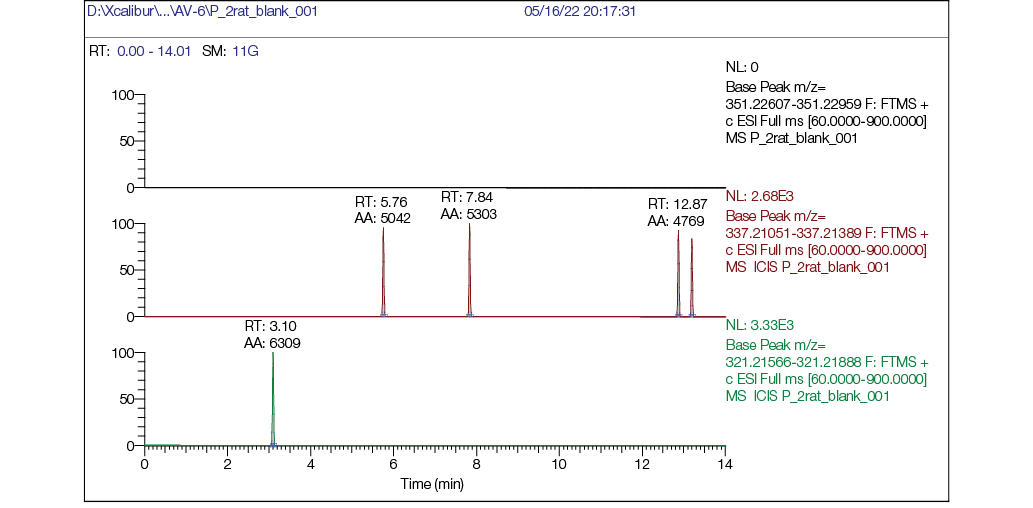
Figure prepared by the authors using their own data
Fig. 2. Rat plasma blank chromatogram: а — mass chromatogram reconstructed for exact ion mass [M + H] + с m/z 351,22783 (AV6); b — mass chromatogram reconstructed for exact ion mass [M + H] + с m/z 337,21218 (M1); c — mass chromatogram reconstructed for exact ion mass [M + H] + с m/z 321,21727 (M2)
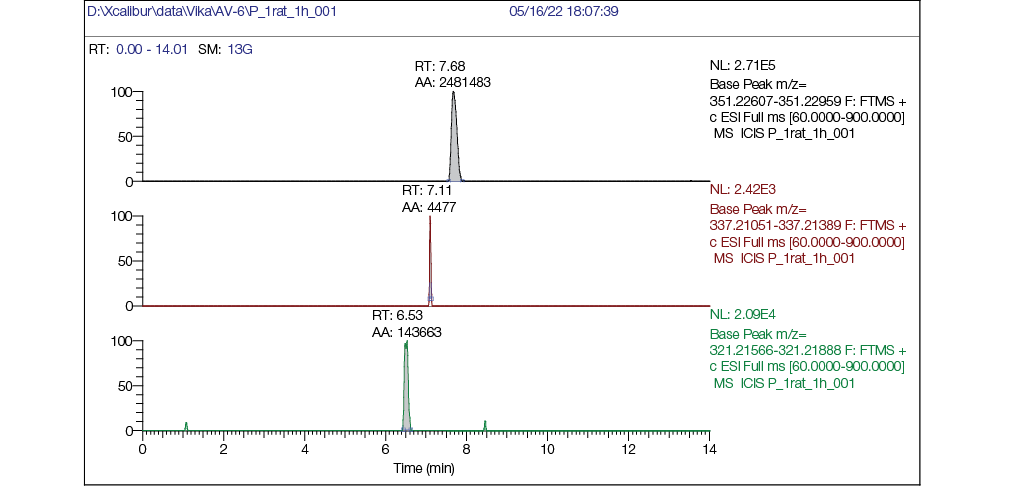
Figure prepared by the authors using their own data
Fig. 3. Rat plasma chromatogram 1 hour post single intragastric administration of AV6 (25 mg/kg bw): a — mass chromatogram reconstructed for exact ion mass [M + H] + с m/z 351,22783 (AV6); b — mass chromatogram reconstructed for exact ion mass [M + H] + с m/z 337,21218 (M1); c — mass chromatogram reconstructed for exact ion mass [M + H] + с m/z 321,21727 (M2)
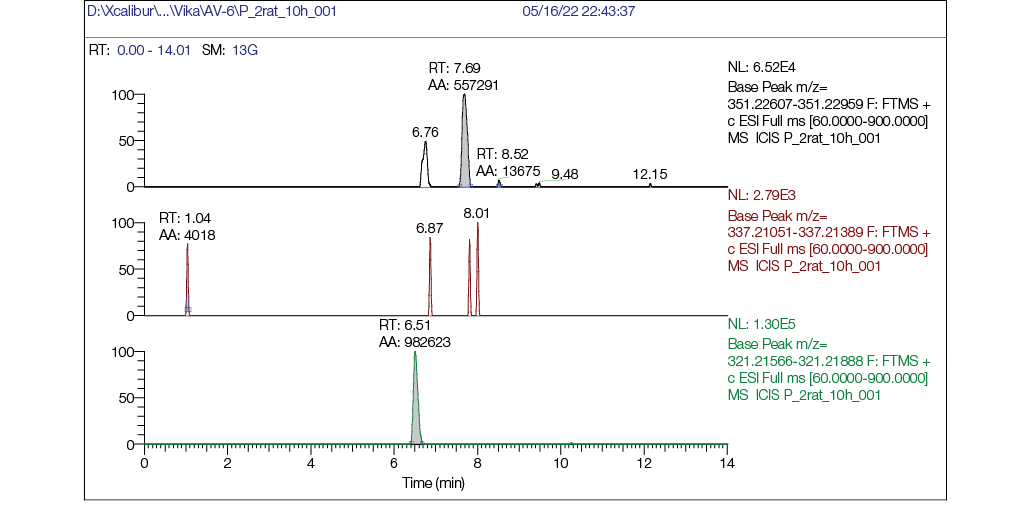
Figure prepared by the authors using their own data
Fig. 4. Chromatogram of rat plasma 10 h after single intragastric administration of AV6 (25 mg/kg bw): a — mass chromatogram reconstructed for exact ion mass [M + H] + с m/z 351,22783 (AV6); b — mass chromatogram reconstructed for exact ion mass [M + H] + с m/z 337,21218 (M1); c — mass chromatogram reconstructed for exact ion mass [M + H] + с m/z 321,21727 (M2)
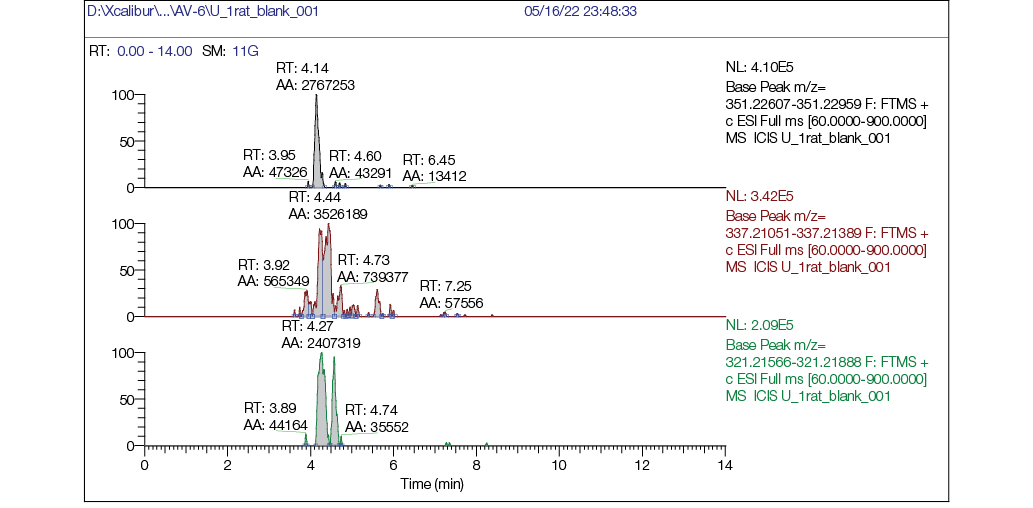
Figure prepared by the authors using their own data
Fig. 5. Chromatogram of rat urine blank sample: а — mass chromatogram reconstructed for exact ion mass [M + H] + с m/z 351,22783 (AV-6); b — mass chromatogram reconstructed for exact ion mass [M + H] + с m/z 337,21218 (M1); c — mass chromatogram reconstructed for exact ion mass [M + H] + с m/z 321,21727 (M2)
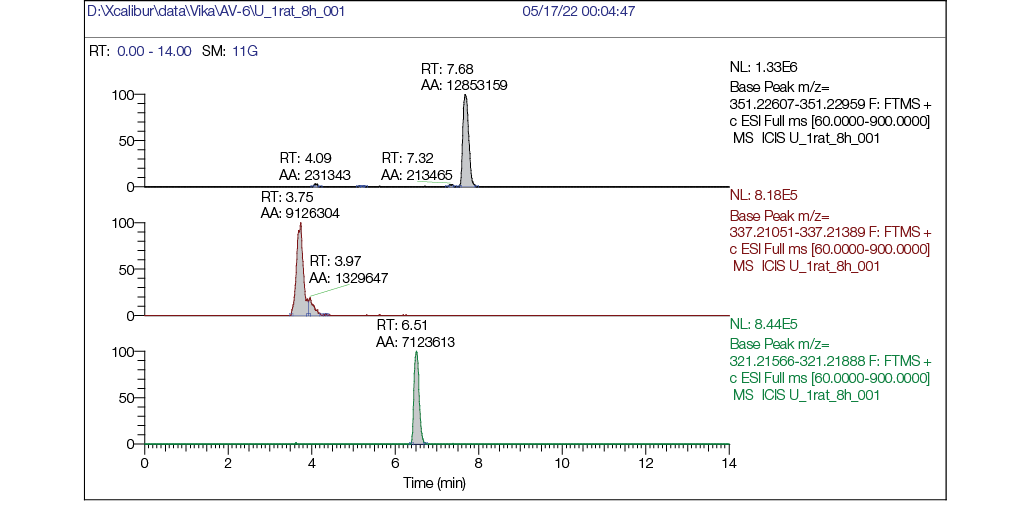
Figure prepared by the authors using their own data
Fig. 6. Chromatogram of a rat urine sample 8 h after a single intragastric administration of AV6 at a dose of
25 mg/kg bw: a — mass chromatogram reconstructed for exact ion mass [M + H] + с m/z 351,22783 (AV6), RT = 7.68 min; b — mass chromatogram reconstructed for exact ion mass [M + H] + с m/z 337,21218 (M1) RT = 3.75 min; c — mass chromatogram reconstructed for exact ion mass [M + H] + с m/z 321,21727 (M2) RT = 6.51 min
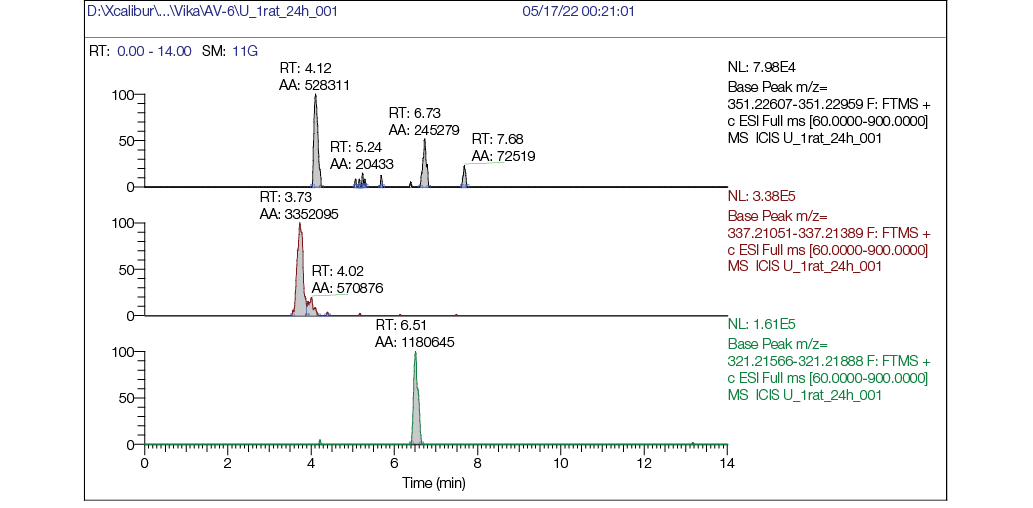
Figure prepared by the authors using their own data
Fig. 7. Chromatogram of rat urine sample 24 h post single intragastric administration of AV6 (25 mg/kg bw):
a — mass chromatogram reconstructed for exact ion mass [M + H] + с m/z 351,22783 (AV6); b — mass chromatogram reconstructed for exact ion mass [M + H] + с m/z 337,21218 (M1); c — mass chromatogram reconstructed for exact ion mass [M + H] + с m/z 321,21727 (M2)
The conducted preclinical study to evaluate the acute toxicity, metabolism, and pharmacokinetics of AV6 represents a crucial step in translating previous findings on the antitumor potential of this derivative of natural phaeosphaeride A and advancing in vivo research. The investigated derivative of natural phaeosphaeride A — AV6 — can be classified as hazard class 3. No statistically significant changes were observed in the internal organs of experimental animals compared to the control group.
As a result of this study, a quantitative determination procedure for AV6 based on HPLC–MS/MS analysis has been developed. For the first time, data on metabolites formed in rats have been obtained. The pharmacokinetic data of AV6 following intragastric administration in an oil-alcohol emulsion suggest that its pharmacokinetics can be formally described using a non-compartmental model. However, additional analysis of its distribution into hydrophobic compartments may be required, considering its physicochemical properties.
The data on AV6 metabolites obtained during the pharmacokinetic study in rats indicate that the metabolic rate of the compound is relatively low and is primarily driven by chemical transformations at the nitrogen atom of the lactam ring. This results in the formation of metabolites that can be excreted in urine. The most likely mechanisms of these transformations include oxidative deacylation followed by hydrolysis.
1 Luellman H, Mohr K, Hein L. Pocket atlas of pharmacology. 4th ed. Thieme; 2011.
2 Key Scientific Achievements in Medicinal Chemistry in 2023. Scientific Council on Medicinal Chemistry of the Russian Academy of Sciences, Division of Chemistry and Materials Science of the Russian Academy of Sciences. 2024.
3 Guidance on Nonclinical Safety Studies for the Conduct of Human Clinical Trials and Marketing Authorization for Pharmaceuticals M3(R2) CPMP/ICH/286/95 (2009). The European Agency for the Evaluation of Medicinal Products. Human medicines evaluation unit.
4 Federal Law No. 61-FZ of 12.04.2010 “On Circulation of Medicinal Products”.
5 GOST R 53434-2009 National Standard of the Russian Federation Principles of Good Laboratory Practice (GLP) Moscow: Standartinform; 2010.
6 Good laboratory practice: OECD principles and guidance for compliance monitoring. 2005.
7 Mironov A.N., editor. Guidelines for Conducting Preclinical Studies of Pharmaceuticals. Part One. Moscow: Grif & K; 2012.
8 European Parliament and Council. Directive 2010/63/EU of the European Parliament and of the council of 22 Sept. 2010 on the protection of animals used for scientific purposes. Official Journal of the European Union. 2010; 276:33–79.
9.
10 Test Guideline 423. OECD guideline for testing of chemicals. Acute oral toxicity — Acute toxic class method. 2002b. OECD, Sep. 2021.
1. Moten A, Schafer D, Farmer P, Kim J, Ferrari M. Redefining global health priorities: Improving cancer care in developing settings. Journal of Global Health. 2014;4(1):010304. https://doi.org/10.7189/jogh.04.010304
2. Delahaye C, Figarol S, Pradines A, Favre G, Mazieres J, Calvayrac O. Early steps of resistance to target therapies in non-small-cell lung cancer. Cancer.2022;14(11):2613. https://doi.org/10.3390/cancers14112613
3. Whitmire M, Ammerman J, de Lisio P, Killmer J, Kyle D, Mainstone E, et al. LC-MS/MS Bioanalysis Method Development, Validation, and Sample Analysis: Points to Consider When Conducting Nonclinical and Clinical Studies in Accordance with Current Regulatory Guidances. Journal of Analytical and Bioanalytical Techniques. 2011;1(1):S4–001. https://doi.org/10.4172/2155-9872.S4-001
4. Maloney KN, Hao W, Xu J, Gibbons J, Hucul J, Roll D, et al. Phaeosphaeride A, an inhibitor of STAT3-dependent signaling isolated from an endophytic fungus. Organic Letters 2006;8(18):4067–70. https://doi.org/10.1021/ol061556f
5. Abzianidze VV, Efimova KP, Poluektova EK, Trishin YuG, Kuznetsov VA. Synthesis and characterization of natural phaeosphaeride A and semi-natural phaeosphaeride B derivatives. Mendeleev Communications. 2017;27(5):490–2. https://doi.org/10.1016/j.mencom.2017.09.020
6. Abzianidze VV, Zakharenkova S, Kuznetsov VA, Beltyukov P, Moiseeva N, Mejia J, et al. Synthesis and Biological Evaluation of Phaeosphaeride A Derivatives as Antitumor Agents. Molecules. 2018;23(11):3043. https://doi.org/10.3390/molecules23113043
7. Abzianidze VV, Moiseeva NI, Suponina DS, Zakharenkova SA, Rogovskaya NYu, Laletina LA, et al. Natural Phaeosphaeride A Derivatives Overcome Drug Resistance of Tumor Cells and Modulate Signaling Pathways. Pharmaceuticals. 2022;15(4):395. https://doi.org/10.3390/ph15040395
8. Abzianidze VV, Kadochnikov VV, Suponina DS, Skvortsov NV, Beltyukov PP, et al. X-ray structure and in silico molecular docking of a natural phaeosphaeride A derivative for targets associated with kinase cascades. Mendeleev Communications. 2023;33:534–6. https://doi.org/10.1016/j.mencom.2023.06.030
9. Abzianidze VV, Beltyukov PP, Zakharenkova SA, Kuznetsov VA, Lukina DS, Ukolov AI, et al. New phaeosphaeride derivatives with antitumor activity, method for obtaining and application of these compounds. Patent of Russian Federation No. 2748533;2021 (In Russ.). EDN: HBRZRK
10. Abzianidze VV, Moiseeva NI, Beltyukov PP, Zakharenkova SA, Kuznetsov VA, Suponina DS, et al. New phaeosphaeride derivatives with cytotoxic, antitumor activity and the ability to overcome drug resistance. Patent of Russian Federation No. 2809986;2023 (In Russ.). EDN: LVBHXG
11. Bijsterbosch MK, Duursma AM, Bouma JM, Gruber M. The plasma volume of the Wistar rat in relation to the body weight. Experientia. 1981;37(4):381–2. https://doi.org/10.1007/BF01959874
12. Diehl KH, Hull R, Morton D, Pfister R, Rabemampianina Y, Smith D, et al. A good practice guide to the administration of substances and removal of blood, including routes and volumes. Journal of Applied Toxicology. 2001;21(1):15–23. https://doi.org/10.1002/jat.727
Victoria V. Abzianidze - Cand. Sci. (Chem.)
Leningrad Region
Nikita V. Skvortsov
Leningrad Region
Georgii V. Karakashev - Cand. Sci. (Biol.)
Leningrad Region
Petr P. Beltyukov - Cand. Sci. (Med.)
Leningrad Region
Diana S. Suponina
Leningrad Region
Valeriya O. Musatova
Leningrad Region
Alexander S. Bogachenkov - Cand. Sci. (Chem.)
Leningrad Region
Denis V. Krivorotov - Cand. Sci. (Chem.)
Leningrad Region
Abzianidze V.V., Skvortsov N.V., Karakashev G.V., Beltyukov P.P., Suponina D.S., Musatova V.O., Bogachenkov A.S., Krivorotov D.V. Evaluation of acute toxicity and pharmacokinetics of a natural phaeosphaeride A derivative in laboratory rodents. Extreme Medicine. 2025;27(4):441-452. https://doi.org/10.47183/mes.2025-303
10 bld. 1 Pogodinskaya Str., Moscow, Russia 119121
tel.: +7 (495) 540-61-71, ext.: 4190, 4191, 4192
E-mail: Extrememedicine@cspfmba.ru
Processing of personal data